


How do you graph the equation \[y = - 4\] by making a table and what is its domain and range?
Answer
579.6k+ views
Hint: Here, the value of \[y\] is constant, so we will select some arbitrary values of \[x\] to find the different coordinate points. To do this, we will make a table consisting of values of \[x\] and corresponding values of \[y\]. Then, we will draw the graph of the equation using the points and then find the domain and range.
Complete step by step solution:
The equation given to us is \[y = - 4\]. We have to graph this equation and find its domain and range. Let us assume \[f(x) = y = - 4\].
Let us take \[x = 0\]. We get \[y = - 4\].
If we take \[x = - 4\], we get \[y = - 4\] again. So, no matter what value of \[x\] we take, we will always get the value of \[y\] as \[y = - 4\]. Let us form a table and graph the equation \[y = - 4\] using the table.
So, we get the points as \[A( - 4, - 4)\], \[B(0, - 4)\] and \[C(3, - 4)\]. Now we will draw the graph by plotting these points
We get the graph as follows:
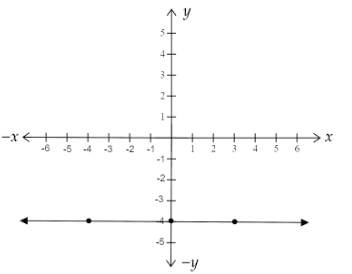
We can see from the above graph that the graph of \[f(x)\] is a horizontal line passing through the point \[y = - 4\]. This is because the function \[f\] is a constant function.
Now, let us find the domain and range of the function \[f\].
The domain of a function \[f\] is the set of all inputs of the function. In the given function, we consider all real numbers as inputs. So, the domain is the entire real line \[\mathbb{R} = ( - \infty ,\infty )\]
The range of a function \[f\] is the set of all outputs of the function. In the given function, we have only one output which is \[ - 4\]. So, the range is \[\{ - 4\} \].
Note:
A constant function is defined a function \[f:\mathbb{R} \to \mathbb{R}\], where \[f(x) = c\], for all \[x \in \mathbb{R}\] and \[c\] is a constant. The graph of a constant function will be a line parallel to the \[x - \]axis. It lies above the \[x - \] axis if \[c\] is positive, below the \[x - \] axis if \[c\] is negative and coincident with the \[x - \] axis if \[c\] is zero. In the given problem, \[c = - 4\] which is negative and so, we get a line below the \[x - \] axis.
Complete step by step solution:
The equation given to us is \[y = - 4\]. We have to graph this equation and find its domain and range. Let us assume \[f(x) = y = - 4\].
Let us take \[x = 0\]. We get \[y = - 4\].
If we take \[x = - 4\], we get \[y = - 4\] again. So, no matter what value of \[x\] we take, we will always get the value of \[y\] as \[y = - 4\]. Let us form a table and graph the equation \[y = - 4\] using the table.
| \[x\] | \[f(x) = y\] |
| \[-4\] | \[ - 4\] |
| 0 | \[ - 4\] |
| 3 | \[ - 4\] |
So, we get the points as \[A( - 4, - 4)\], \[B(0, - 4)\] and \[C(3, - 4)\]. Now we will draw the graph by plotting these points
We get the graph as follows:
We can see from the above graph that the graph of \[f(x)\] is a horizontal line passing through the point \[y = - 4\]. This is because the function \[f\] is a constant function.
Now, let us find the domain and range of the function \[f\].
The domain of a function \[f\] is the set of all inputs of the function. In the given function, we consider all real numbers as inputs. So, the domain is the entire real line \[\mathbb{R} = ( - \infty ,\infty )\]
The range of a function \[f\] is the set of all outputs of the function. In the given function, we have only one output which is \[ - 4\]. So, the range is \[\{ - 4\} \].
Note:
A constant function is defined a function \[f:\mathbb{R} \to \mathbb{R}\], where \[f(x) = c\], for all \[x \in \mathbb{R}\] and \[c\] is a constant. The graph of a constant function will be a line parallel to the \[x - \]axis. It lies above the \[x - \] axis if \[c\] is positive, below the \[x - \] axis if \[c\] is negative and coincident with the \[x - \] axis if \[c\] is zero. In the given problem, \[c = - 4\] which is negative and so, we get a line below the \[x - \] axis.
Recently Updated Pages
Master Class 11 Economics: Engaging Questions & Answers for Success
Master Class 11 English: Engaging Questions & Answers for Success
Master Class 11 Maths: Engaging Questions & Answers for Success
Class 11 Question and Answer - Your Ultimate Solutions Guide
Master Class 11 Social Science: Engaging Questions & Answers for Success
Master Class 11 Business Studies: Engaging Questions & Answers for Success
Trending doubts
Differentiate between an exothermic and an endothermic class 11 chemistry CBSE
One Metric ton is equal to kg A 10000 B 1000 C 100 class 11 physics CBSE
There are 720 permutations of the digits 1 2 3 4 5 class 11 maths CBSE
In what year Guru Nanak Dev ji was born A15 April 1469 class 11 social science CBSE
Difference Between Prokaryotic Cells and Eukaryotic Cells
Draw a diagram of a plant cell and label at least eight class 11 biology CBSE