


How do you graph the equation \[x = 10 - y\] by making a table and what is its domain and range ?
Answer
572.1k+ views
Hint:We need to draw the graph ‘x’ versus ‘y’. We give the random values for ‘x’ and we find the value of ‘y’. We can give all real numbers for the value of ‘x’. Thus we will have coordinate points (x, y). Hence, we can plot the graph by using the values. We can also draw the graph using the intercept method. Here we will have a line parallel to x-axis.
Complete step by step answer:
Given \[x = 10 - y\]. Rearranging we have \[y = 10 - x\].
Let's give the values for ‘x’ and we find the value of ‘y’.
Put \[x = 1\]in \[y = 10 - x\] we have,
\[y = 10 - 1 = 9\]
Thus we have coordinate points \[(1,9)\].
Put \[x = - 1\]in \[y = 10 - x\] we have,
\[y = 10 - ( - 1)\]
\[\Rightarrow y = 10 + 1\]
\[\Rightarrow y = 11\]
Thus we have coordinate points \[( - 1,11)\].
Put \[x = 2\]in \[y = 10 - x\] we have,
\[y = 10 - 2 = 8\]
Thus we have coordinate points \[(2,8)\].
Put \[x = - 2\]in \[y = 10 - x\] we have,
\[y = 10 - ( - 2)\]
\[\Rightarrow y = 10 + 2\]
\[\Rightarrow y = 12\]
Thus we have coordinate points \[( - 2,12)\].
Put \[x = 3\]in \[y = 10 - x\] we have,
\[y = 10 - 3 = 7\]
Thus we have a coordinate point after rounding off is \[(3,7)\].
Put \[x = - 3\]in \[y = 10 - x\] we have,
\[y = 10 - ( - 3)\]
\[\Rightarrow y = 10 + 3\]
\[\Rightarrow y= 13\]
Thus we have coordinate point after rounding off is \[( - 3,13)\]
Put \[x = 4\]in \[y = 10 - x\] we have,
\[y = 10 - 4 = 6\]
Thus we have coordinate points \[(4,6)\].
Put \[x = - 4\]in \[y = 10 - x\] we have,
\[y = 10 - ( - 4)\]
\[\Rightarrow y= 10 + 4\]
\[\Rightarrow y= 14\]
Thus we have coordinate point \[( - 4,14)\]. Thus we have,
Let’s draw the graph for these coordinates,
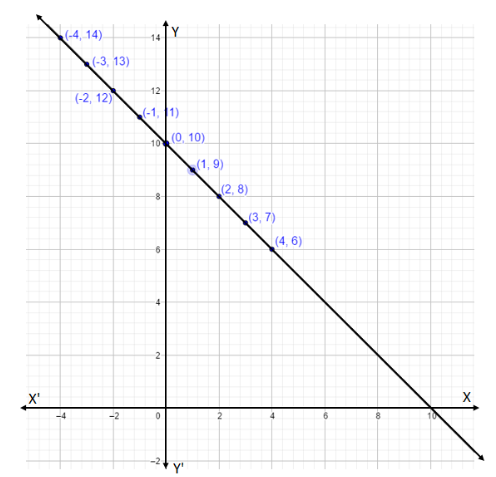
We expanded the line. We can see that ‘y’ is having all the real numbers.
Hence the domain is all real numbers. Also ‘x’ can have all the real numbers, hence the range is all the real numbers.
Note:We have two curves. One curve is for positive ‘x’ values and the other curve is for negative ‘x’ values. A graph shows the relation between two variable quantities, it contains two axes perpendicular to each other namely the x-axis and the y-axis. Each variable is measured along one of the axes. In the question, we are given one linear equation containing two variables namely x and y, x is measured along the x-axis and y is measured along the y-axis while tracing the given equations.
Complete step by step answer:
Given \[x = 10 - y\]. Rearranging we have \[y = 10 - x\].
Let's give the values for ‘x’ and we find the value of ‘y’.
Put \[x = 1\]in \[y = 10 - x\] we have,
\[y = 10 - 1 = 9\]
Thus we have coordinate points \[(1,9)\].
Put \[x = - 1\]in \[y = 10 - x\] we have,
\[y = 10 - ( - 1)\]
\[\Rightarrow y = 10 + 1\]
\[\Rightarrow y = 11\]
Thus we have coordinate points \[( - 1,11)\].
Put \[x = 2\]in \[y = 10 - x\] we have,
\[y = 10 - 2 = 8\]
Thus we have coordinate points \[(2,8)\].
Put \[x = - 2\]in \[y = 10 - x\] we have,
\[y = 10 - ( - 2)\]
\[\Rightarrow y = 10 + 2\]
\[\Rightarrow y = 12\]
Thus we have coordinate points \[( - 2,12)\].
Put \[x = 3\]in \[y = 10 - x\] we have,
\[y = 10 - 3 = 7\]
Thus we have a coordinate point after rounding off is \[(3,7)\].
Put \[x = - 3\]in \[y = 10 - x\] we have,
\[y = 10 - ( - 3)\]
\[\Rightarrow y = 10 + 3\]
\[\Rightarrow y= 13\]
Thus we have coordinate point after rounding off is \[( - 3,13)\]
Put \[x = 4\]in \[y = 10 - x\] we have,
\[y = 10 - 4 = 6\]
Thus we have coordinate points \[(4,6)\].
Put \[x = - 4\]in \[y = 10 - x\] we have,
\[y = 10 - ( - 4)\]
\[\Rightarrow y= 10 + 4\]
\[\Rightarrow y= 14\]
Thus we have coordinate point \[( - 4,14)\]. Thus we have,
| \[x\] | \[1\] | \[ - 1\] | \[2\] | \[ - 2\] | \[3\] | \[ - 3\] | \[4\] | \[ - 4\] |
| \[y\] | \[9\] | \[11\] | \[8\] | \[12\] | \[7\] | \[13\] | \[6\] | \[14\] |
Let’s draw the graph for these coordinates,
We expanded the line. We can see that ‘y’ is having all the real numbers.
Hence the domain is all real numbers. Also ‘x’ can have all the real numbers, hence the range is all the real numbers.
Note:We have two curves. One curve is for positive ‘x’ values and the other curve is for negative ‘x’ values. A graph shows the relation between two variable quantities, it contains two axes perpendicular to each other namely the x-axis and the y-axis. Each variable is measured along one of the axes. In the question, we are given one linear equation containing two variables namely x and y, x is measured along the x-axis and y is measured along the y-axis while tracing the given equations.
Recently Updated Pages
Master Class 12 Business Studies: Engaging Questions & Answers for Success
Master Class 12 Biology: Engaging Questions & Answers for Success
Master Class 12 Chemistry: Engaging Questions & Answers for Success
Class 12 Question and Answer - Your Ultimate Solutions Guide
Master Class 11 Social Science: Engaging Questions & Answers for Success
Master Class 11 English: Engaging Questions & Answers for Success
Trending doubts
What is the Full Form of ICSE / ISC ?
Fill the blanks with the suitable prepositions 1 The class 9 english CBSE
Difference Between Plant Cell and Animal Cell
How many hours before the closure of election must class 9 social science CBSE
What is pollution? How many types of pollution? Define it
Name 10 Living and Non living things class 9 biology CBSE