


How do you graph the equation by plotting three points \[y = - x + 2\] ?
Answer
534k+ views
Hint: To graph an equation by plotting points, we need to select values for x at random, and substitute the x values in the given equation and solve it, hence we get the three points by solving and to graph a line, we need to graph the three points and then connect the points with a straight line.
Complete step by step solution:
Let us write the given linear equation:
\[y = - x + 2\]
This is the equation of a line of the form \[y = mx + c\] ; hence here we are asked to plot for three points. To graph the solution for the given equation, we need to select values for x at random. So, to find three points on the line, plug random values of x and solve for y to get the corresponding values as:
Selecting values for x at random as:
Let \[x = - 1\] ,then we have:
\[y = - x + 2\]
\[ \Rightarrow y = - \left( { - 1} \right) + 2\]
Simplifying we get:
\[ \Rightarrow y = 1 + 2 = 3\]
Therefore, the points are: \[\left( { - 1,3} \right)\] .
Let \[x = 0\] ,then we have:
\[y = - x + 2\]
\[y = 0 + 2 = 2\]
Therefore, the points are: \[\left( {0,2} \right)\] .
Let \[x = 1\] ,then we have:
\[y = - x + 2\]
\[y = - 1 + 2 = 1\]
Therefore, the points are: \[\left( {1,1} \right)\] .
Now, we now have three sets of point as:
Point P1: \[\left( {x,y} \right) = \left( { - 1,3} \right)\]
Point P2: \[\left( {x,y} \right) = \left( {0,2} \right)\]
Point P3: \[\left( {x,y} \right) = \left( {1,1} \right)\]
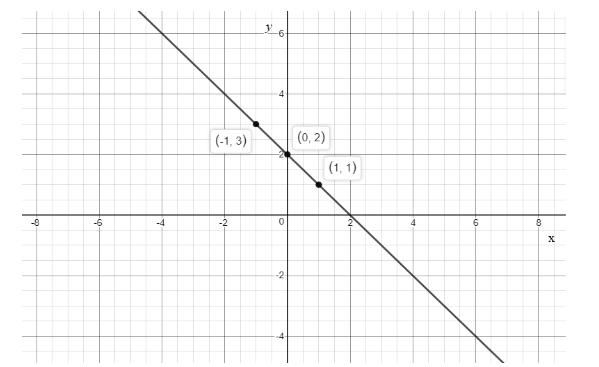
Now, let us graph the solution: To graph this line, first graph the three points as shown \[\left( { - 1,3} \right)\] , \[\left( {0,2} \right)\] and \[\left( {1,1} \right)\] ,then connect the three points with a straight line.
Note: The key point to plot the points is that the ordered pair is very important, in which x and y values are plotted with respect to the considered random values of x hence the main step is to consider the appropriate values for x. If we are asked to plot using intercepts then, x-intercept is found by the value of x when y = 0, \[\left( {x,0} \right)\] and y-intercept is found by the value of y when x = 0, \[\left( {0,y} \right)\] and when we are finding x-intercept y-coordinate is zero and vice versa then solve for x and y intercepts and the line can be graphed using the points.
Complete step by step solution:
Let us write the given linear equation:
\[y = - x + 2\]
This is the equation of a line of the form \[y = mx + c\] ; hence here we are asked to plot for three points. To graph the solution for the given equation, we need to select values for x at random. So, to find three points on the line, plug random values of x and solve for y to get the corresponding values as:
Selecting values for x at random as:
Let \[x = - 1\] ,then we have:
\[y = - x + 2\]
\[ \Rightarrow y = - \left( { - 1} \right) + 2\]
Simplifying we get:
\[ \Rightarrow y = 1 + 2 = 3\]
Therefore, the points are: \[\left( { - 1,3} \right)\] .
Let \[x = 0\] ,then we have:
\[y = - x + 2\]
\[y = 0 + 2 = 2\]
Therefore, the points are: \[\left( {0,2} \right)\] .
Let \[x = 1\] ,then we have:
\[y = - x + 2\]
\[y = - 1 + 2 = 1\]
Therefore, the points are: \[\left( {1,1} \right)\] .
Now, we now have three sets of point as:
Point P1: \[\left( {x,y} \right) = \left( { - 1,3} \right)\]
Point P2: \[\left( {x,y} \right) = \left( {0,2} \right)\]
Point P3: \[\left( {x,y} \right) = \left( {1,1} \right)\]
Now, let us graph the solution: To graph this line, first graph the three points as shown \[\left( { - 1,3} \right)\] , \[\left( {0,2} \right)\] and \[\left( {1,1} \right)\] ,then connect the three points with a straight line.
Note: The key point to plot the points is that the ordered pair is very important, in which x and y values are plotted with respect to the considered random values of x hence the main step is to consider the appropriate values for x. If we are asked to plot using intercepts then, x-intercept is found by the value of x when y = 0, \[\left( {x,0} \right)\] and y-intercept is found by the value of y when x = 0, \[\left( {0,y} \right)\] and when we are finding x-intercept y-coordinate is zero and vice versa then solve for x and y intercepts and the line can be graphed using the points.

Recently Updated Pages
Master Class 8 Social Science: Engaging Questions & Answers for Success
Master Class 8 English: Engaging Questions & Answers for Success
Class 8 Question and Answer - Your Ultimate Solutions Guide
Master Class 8 Maths: Engaging Questions & Answers for Success
Master Class 8 Science: Engaging Questions & Answers for Success
Master Class 9 General Knowledge: Engaging Questions & Answers for Success
Trending doubts
What is BLO What is the full form of BLO class 8 social science CBSE
Citizens of India can vote at the age of A 18 years class 8 social science CBSE
Full form of STD, ISD and PCO
Advantages and disadvantages of science
Right to vote is a AFundamental Right BFundamental class 8 social science CBSE
What are the 12 elements of nature class 8 chemistry CBSE