


How do you graph the equation by plotting points $3x-2y=15$?
Answer
524.4k+ views
Hint: To plot a graph we need to find the change that occurs in the dependent variable $y$ w.r.t. the independent variable $x$. We can simply plug in any value of $x$ and obtain the value of $y$ or we can do the other way round i.e. plug the values of $y$ and obtain the value of $x$. Both ways, we are going to obtain an ordered pair and putting that on the axes and joining the lines or the curve we will obtain the graph of the equation.
Complete step by step solution:
We first observe that the curve given to us is that of a straight line because both the dependent and the independent variables are in linear power. Moreover, we use the fact that for any two points on the axes, there is only a unique line that passes through them. So, it suffices to find any two points that lie on this line and joining those points we can easily say that the graph has been obtained.
We start by finding two points on the line. The simplest trick is to plug the value 0 one by one. So we first put the independent variable equal to 0. So, put $x=0$, we get:
$3\times 0-2y=15$
$\implies -2y=15$
$\implies y=-\dfrac{15}{2}$
So, we obtain the coordinate $\left(0,-\dfrac{15}{2}\right)$
Next, we put $y=0$, and we get:
$3\times x-2\times 0=15$
$\implies 3x=15$
$\implies x=5$
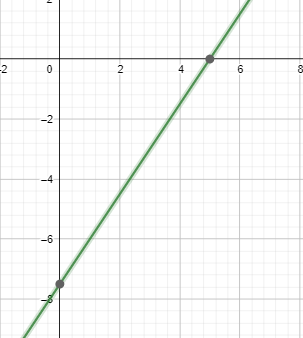
Hence, the next coordinate obtained is $\left(5,0\right)$
Plotting this we obtain the following graph of the given equation:
Note:
You can also find some more points on the line and cross check whether they lie on the line or not. This way you would be able to find the answer more accurately since you will have double checked the answer. Moreover, if the points are not lying on a single line then you need to see any calculation mistake that you might have made.
Complete step by step solution:
We first observe that the curve given to us is that of a straight line because both the dependent and the independent variables are in linear power. Moreover, we use the fact that for any two points on the axes, there is only a unique line that passes through them. So, it suffices to find any two points that lie on this line and joining those points we can easily say that the graph has been obtained.
We start by finding two points on the line. The simplest trick is to plug the value 0 one by one. So we first put the independent variable equal to 0. So, put $x=0$, we get:
$3\times 0-2y=15$
$\implies -2y=15$
$\implies y=-\dfrac{15}{2}$
So, we obtain the coordinate $\left(0,-\dfrac{15}{2}\right)$
Next, we put $y=0$, and we get:
$3\times x-2\times 0=15$
$\implies 3x=15$
$\implies x=5$
Hence, the next coordinate obtained is $\left(5,0\right)$
Plotting this we obtain the following graph of the given equation:
Note:
You can also find some more points on the line and cross check whether they lie on the line or not. This way you would be able to find the answer more accurately since you will have double checked the answer. Moreover, if the points are not lying on a single line then you need to see any calculation mistake that you might have made.
Recently Updated Pages
Master Class 11 English: Engaging Questions & Answers for Success
Master Class 11 Maths: Engaging Questions & Answers for Success
Master Class 11 Biology: Engaging Questions & Answers for Success
Master Class 11 Social Science: Engaging Questions & Answers for Success
Master Class 11 Physics: Engaging Questions & Answers for Success
Master Class 11 Accountancy: Engaging Questions & Answers for Success
Trending doubts
One Metric ton is equal to kg A 10000 B 1000 C 100 class 11 physics CBSE
There are 720 permutations of the digits 1 2 3 4 5 class 11 maths CBSE
Discuss the various forms of bacteria class 11 biology CBSE
Draw a diagram of a plant cell and label at least eight class 11 biology CBSE
State the laws of reflection of light
Explain zero factorial class 11 maths CBSE