


How do you graph the equation by plotting points \[2x - 2y = 6\]?
Answer
568.5k+ views
Hint: The given equation is a linear equation and so obtain at least two points that satisfy the given linear equation and plot those points on the rectangular Cartesian coordinate system and draw a line that passes through them.
Complete step by step solution:
Write the given linear equation.
\[2x - 2y = 6\] …… (1)
Isolate one of the variables and express it in terms of the other variable.
Here, we isolate the variable \[x\] in terms of the variable \[y\]as follows:
Add \[2y\] to both sides of the linear equation (1) as shown below.
\[ \Rightarrow 2x - 2y + 2y = 6 + 2y\]
\[ \Rightarrow 2x = 6 + 2y\]
Now, divide the above obtained equation by \[2\] and simplify as shown below.
\[ \Rightarrow \dfrac{{2x}}{2} = \dfrac{{6 + 2y}}{2}\]
\[ \Rightarrow x = \dfrac{6}{2} + \dfrac{{2y}}{2}\]
\[ \Rightarrow x = 3 + y\]
Therefore, we can write the equation (1) as \[x = 3 + y\].
Now, obtain at least two points by substituting two appropriate values of variable \[y\] and obtain the corresponding values of \[x\] as shown below.
Substitute \[y\] as \[0\] in the transformed equation \[x = 3 + y\] and obtain the value of \[x\],
\[\begin{array}{c}x = 3 + \left( 0 \right)\\ = 3\end{array}\]
Similarly, substitute \[y\] as \[2\] in the transformed equation \[x = 3 + y\] and obtain the value of \[x\],
\[\begin{array}{c}x = 3 + \left( 2 \right)\\= 5\end{array}\]
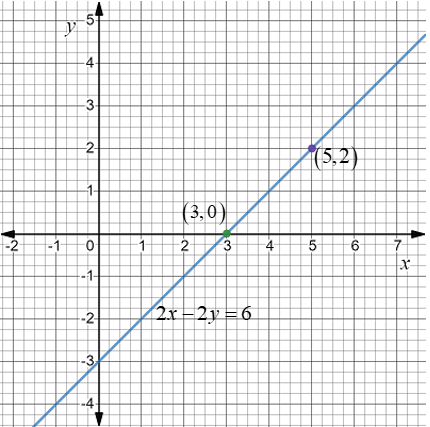
So, the two points to sketch the graph of a given linear equation are \[\left( {3,0} \right)\] and \[\left( {5,3} \right)\] in the form \[\left( {x,y} \right)\].
Therefore, sketch the graph of given linear equation \[2x - 2y = 6\] by locating two points \[\left( {3,0} \right)\] and \[\left( {5,3} \right)\] in the Cartesian plane and draw a line that passes through these two points as shown in the below figure.
So, this is the right way to plot a graph of a given linear equation by plotting points on a Cartesian plane.
Note: Linear equations in two variables have infinite solutions or say points that can satisfy the equation so you can find any two of them to plot a graph or line of that linear equation.
Complete step by step solution:
Write the given linear equation.
\[2x - 2y = 6\] …… (1)
Isolate one of the variables and express it in terms of the other variable.
Here, we isolate the variable \[x\] in terms of the variable \[y\]as follows:
Add \[2y\] to both sides of the linear equation (1) as shown below.
\[ \Rightarrow 2x - 2y + 2y = 6 + 2y\]
\[ \Rightarrow 2x = 6 + 2y\]
Now, divide the above obtained equation by \[2\] and simplify as shown below.
\[ \Rightarrow \dfrac{{2x}}{2} = \dfrac{{6 + 2y}}{2}\]
\[ \Rightarrow x = \dfrac{6}{2} + \dfrac{{2y}}{2}\]
\[ \Rightarrow x = 3 + y\]
Therefore, we can write the equation (1) as \[x = 3 + y\].
Now, obtain at least two points by substituting two appropriate values of variable \[y\] and obtain the corresponding values of \[x\] as shown below.
Substitute \[y\] as \[0\] in the transformed equation \[x = 3 + y\] and obtain the value of \[x\],
\[\begin{array}{c}x = 3 + \left( 0 \right)\\ = 3\end{array}\]
Similarly, substitute \[y\] as \[2\] in the transformed equation \[x = 3 + y\] and obtain the value of \[x\],
\[\begin{array}{c}x = 3 + \left( 2 \right)\\= 5\end{array}\]
So, the two points to sketch the graph of a given linear equation are \[\left( {3,0} \right)\] and \[\left( {5,3} \right)\] in the form \[\left( {x,y} \right)\].
Therefore, sketch the graph of given linear equation \[2x - 2y = 6\] by locating two points \[\left( {3,0} \right)\] and \[\left( {5,3} \right)\] in the Cartesian plane and draw a line that passes through these two points as shown in the below figure.
So, this is the right way to plot a graph of a given linear equation by plotting points on a Cartesian plane.
Note: Linear equations in two variables have infinite solutions or say points that can satisfy the equation so you can find any two of them to plot a graph or line of that linear equation.
Recently Updated Pages
Master Class 12 Economics: Engaging Questions & Answers for Success
Master Class 12 English: Engaging Questions & Answers for Success
Master Class 12 Social Science: Engaging Questions & Answers for Success
Master Class 12 Maths: Engaging Questions & Answers for Success
Master Class 12 Physics: Engaging Questions & Answers for Success
Master Class 10 English: Engaging Questions & Answers for Success
Trending doubts
Who Won 36 Oscar Awards? Record Holder Revealed
The speaker of the Lok Sabha is elected by the APresident class 10 social science CBSE
Explain the double helix structure of DNA with a labeled class 10 biology CBSE
Fill the blanks with proper collective nouns 1 A of class 10 english CBSE
Why did Frederic Sorrieu present utopian vision in class 10 social science CBSE
State BPT theorem and prove it class 10 maths CBSE