


How do you graph \[\tan \left( \left( \dfrac{1}{2} \right)x \right)\]?
Answer
558.9k+ views
Hint: We draw this graph using tangent function concepts. Here we will find the period, intercept, asymptotes and domain using the formulas we have in tangent functions. By using all these factors we will draw the graph of the given equation accordingly.
Complete step by step answer:
Before we proceed we have to know about the tangent function.
The equation that was given to us in the form of \[f\left( \theta \right)=y=\tan k\theta \]
So we should know how to calculate the factors required for this function.
The calculation of factors for this function can be done using the below formulas:
Period=\[\dfrac{\pi }{\left| k \right|}\]
X-scale = \[\dfrac{Period}{2}\]
Domain = The domain of branch is \[\left\{ \theta :-\dfrac{{{90}^{\circ }}}{k} < \theta < \dfrac{{{90}^{\circ }}}{k} \right\}\] because \[f\left( \theta \right)\] is undefined between \[\theta =-\dfrac{{{90}^{\circ }}}{k}\] and \[\theta =\dfrac{{{90}^{\circ }}}{k}\].
Range = \[\left( -\infty ,\infty \right)\].
The asymptotes of this type of function is undefined.
So using these formulas we can solve our question and draw the graph.
Let us find these factors for the angle given to us
Given angle is \[\tan \left( \left( \dfrac{1}{2} \right)x \right)\]
So the factors are
K=\[\dfrac{1}{2}\]
Now the period is
Period= \[\dfrac{\pi }{\left| k \right|}\]
\[\Rightarrow \dfrac{\pi }{\dfrac{1}{2}}\]
\[\Rightarrow 2\pi \]
So the period is \[2\pi \]
Now the x-scale is
X-scale= \[\dfrac{Period}{2}\]
\[\Rightarrow \dfrac{2\pi }{2}\]
\[\Rightarrow \pi \]
Y-scale can be anything because its intercept is always 0
So the x-scale is \[\pi \]
Range: \[\left( -\infty ,\infty \right)\]
Domain: \[\left\{ \theta :-\dfrac{{{90}^{\circ }}}{k} < \theta < \dfrac{{{90}^{\circ }}}{k} \right\}\]
\[\Rightarrow \left\{ \theta :-\dfrac{{{90}^{\circ }}}{\dfrac{1}{2}} < \theta < \dfrac{{{90}^{\circ }}}{\dfrac{1}{2}} \right\}\]
\[\Rightarrow \left\{ \theta :-{{180}^{\circ }} < \theta < {{180}^{\circ }} \right\}\]
So the domain is between \[-{{180}^{\circ }}\] and \[{{180}^{\circ }}\].
Now using these factors we are going to draw the graph
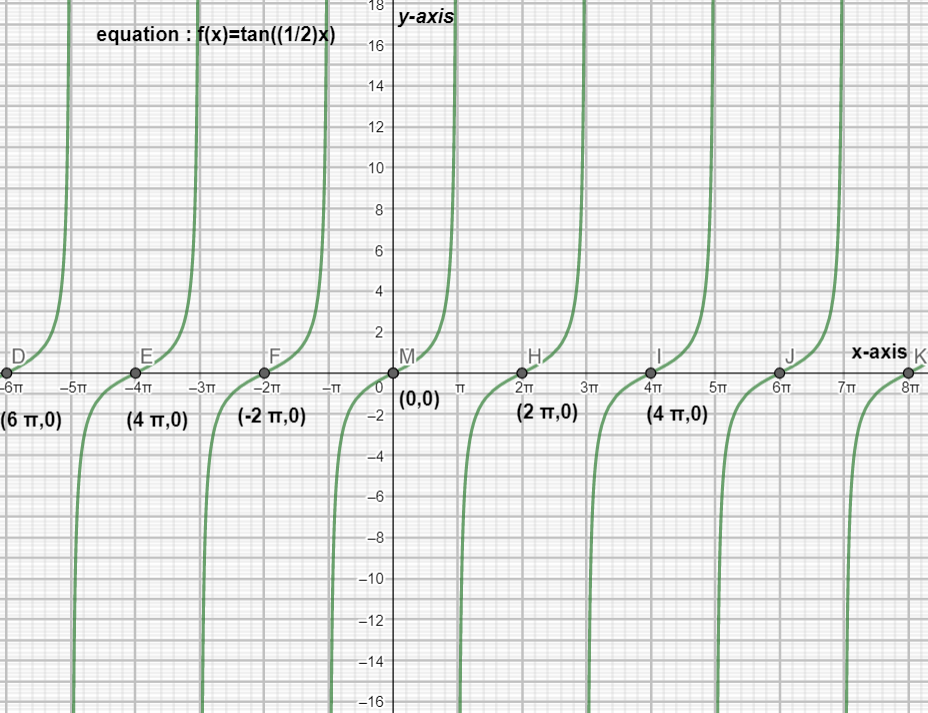
So, here is the graph formed for the given angle using the above factors.
Note:
While drawing the graph we have to be sure about the x and y scale accordingly. Also we have to make sure that calculating the factors is also very important for drawing these graphs.
Complete step by step answer:
Before we proceed we have to know about the tangent function.
The equation that was given to us in the form of \[f\left( \theta \right)=y=\tan k\theta \]
So we should know how to calculate the factors required for this function.
The calculation of factors for this function can be done using the below formulas:
Period=\[\dfrac{\pi }{\left| k \right|}\]
X-scale = \[\dfrac{Period}{2}\]
Domain = The domain of branch is \[\left\{ \theta :-\dfrac{{{90}^{\circ }}}{k} < \theta < \dfrac{{{90}^{\circ }}}{k} \right\}\] because \[f\left( \theta \right)\] is undefined between \[\theta =-\dfrac{{{90}^{\circ }}}{k}\] and \[\theta =\dfrac{{{90}^{\circ }}}{k}\].
Range = \[\left( -\infty ,\infty \right)\].
The asymptotes of this type of function is undefined.
So using these formulas we can solve our question and draw the graph.
Let us find these factors for the angle given to us
Given angle is \[\tan \left( \left( \dfrac{1}{2} \right)x \right)\]
So the factors are
K=\[\dfrac{1}{2}\]
Now the period is
Period= \[\dfrac{\pi }{\left| k \right|}\]
\[\Rightarrow \dfrac{\pi }{\dfrac{1}{2}}\]
\[\Rightarrow 2\pi \]
So the period is \[2\pi \]
Now the x-scale is
X-scale= \[\dfrac{Period}{2}\]
\[\Rightarrow \dfrac{2\pi }{2}\]
\[\Rightarrow \pi \]
Y-scale can be anything because its intercept is always 0
So the x-scale is \[\pi \]
Range: \[\left( -\infty ,\infty \right)\]
Domain: \[\left\{ \theta :-\dfrac{{{90}^{\circ }}}{k} < \theta < \dfrac{{{90}^{\circ }}}{k} \right\}\]
\[\Rightarrow \left\{ \theta :-\dfrac{{{90}^{\circ }}}{\dfrac{1}{2}} < \theta < \dfrac{{{90}^{\circ }}}{\dfrac{1}{2}} \right\}\]
\[\Rightarrow \left\{ \theta :-{{180}^{\circ }} < \theta < {{180}^{\circ }} \right\}\]
So the domain is between \[-{{180}^{\circ }}\] and \[{{180}^{\circ }}\].
Now using these factors we are going to draw the graph
So, here is the graph formed for the given angle using the above factors.
Note:
While drawing the graph we have to be sure about the x and y scale accordingly. Also we have to make sure that calculating the factors is also very important for drawing these graphs.
Recently Updated Pages
Master Class 11 English: Engaging Questions & Answers for Success
Master Class 11 Maths: Engaging Questions & Answers for Success
Master Class 11 Biology: Engaging Questions & Answers for Success
Master Class 11 Physics: Engaging Questions & Answers for Success
Master Class 11 Accountancy: Engaging Questions & Answers for Success
Class 11 Question and Answer - Your Ultimate Solutions Guide
Trending doubts
One Metric ton is equal to kg A 10000 B 1000 C 100 class 11 physics CBSE
Discuss the various forms of bacteria class 11 biology CBSE
Draw a diagram of a plant cell and label at least eight class 11 biology CBSE
State the laws of reflection of light
Explain zero factorial class 11 maths CBSE
10 examples of friction in our daily life