


How do you graph \[r=\sqrt{\cos \left( 2\cdot \theta \right)}\]?
Answer
545.4k+ views
Hint:
In this given question, we have been asked to plot the graph for a given polar form. The polar form of a complex number is the other way to represent a given complex number, the polar form is represented by z = a + bi. When we need to plot the points in the plane, we need to have rectangular coordinate i.e. (x, y). For conversion from polar coordinates to rectangular coordinates, we will need to use the formulas from trigonometric functions.
Complete step by step solution:
We have given that,
\[\Rightarrow r=\sqrt{\cos \left( 2\cdot \theta \right)}\]
Writing the polar-coordinates, we get
To convert from polar coordinates to rectangular coordinates, using the formulas from trigonometric functions definitions:
We have,
\[x=r\cdot \cos \theta \] And \[y=r\cdot \sin \theta \]
So we have that,
\[{{r}^{2}}={{x}^{2}}+{{y}^{2}}\]
And by using trigonometric identity, i.e.
\[\cos \left( 2\theta \right)={{\cos }^{2}}\theta -{{\sin }^{2}}\theta \]
Again, we can write that;
As, \[x=r\cdot \cos \theta ,\ then\ \Rightarrow \cos \theta =\dfrac{x}{r}\]
And, \[y=r\cdot \sin \theta ,\ then\ \Rightarrow \sin \theta =\dfrac{y}{r}\]
Substituting the above values, we get
\[\cos \left( 2\theta \right)={{\cos }^{2}}\theta -{{\sin }^{2}}\theta ={{\left( \dfrac{x}{r} \right)}^{2}}-{{\left( \dfrac{y}{r} \right)}^{2}}\]
So, therefore
\[\Rightarrow r=\sqrt{\cos \left( 2\cdot \theta \right)}\]
Transposing square root to the left side of the above expression, we get
\[\Rightarrow {{r}^{2}}=\cos \left( 2\cdot \theta \right)\]
Substituting the value of \[\cos \left( 2\theta \right)\] in the above expression, we get
\[\Rightarrow {{r}^{2}}={{\left( \dfrac{x}{r} \right)}^{2}}-{{\left( \dfrac{y}{r} \right)}^{2}}\]
Simplifying the above expression, we get
\[\Rightarrow {{r}^{2}}=\dfrac{{{x}^{2}}-{{y}^{2}}}{{{r}^{2}}}\]
Multiply both the sides of the equation by\[{{r}^{2}}\], we get
\[\Rightarrow {{r}^{4}}={{x}^{2}}-{{y}^{2}}\]
Simplifying the exponents in the above expression, we get
\[\Rightarrow {{\left( {{r}^{2}} \right)}^{2}}={{x}^{2}}-{{y}^{2}}\]
Substituting the value of \[{{r}^{2}}={{x}^{2}}+{{y}^{2}}\] in the above expression, we get
\[\Rightarrow {{\left( {{x}^{2}}+{{y}^{2}} \right)}^{2}}={{x}^{2}}-{{y}^{2}}\]
Thus,
The graph of the equation\[{{\left( {{x}^{2}}+{{y}^{2}} \right)}^{2}}={{x}^{2}}-{{y}^{2}}\];
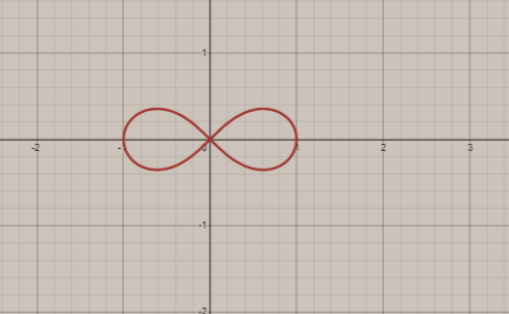
Hence, this is the required graph.
Note:
Students need to remember that polar coordinates are those coordinates that can be plotted into a circular grid. On the other side, rectangular coordinates are those coordinates that can be plotted into a plane i.e. graph and the rectangular coordinates are represented in the form of (x, y). Rectangular coordinates include only numerical values as they represent only horizontal axis and vertical axis.
In this given question, we have been asked to plot the graph for a given polar form. The polar form of a complex number is the other way to represent a given complex number, the polar form is represented by z = a + bi. When we need to plot the points in the plane, we need to have rectangular coordinate i.e. (x, y). For conversion from polar coordinates to rectangular coordinates, we will need to use the formulas from trigonometric functions.
Complete step by step solution:
We have given that,
\[\Rightarrow r=\sqrt{\cos \left( 2\cdot \theta \right)}\]
Writing the polar-coordinates, we get
To convert from polar coordinates to rectangular coordinates, using the formulas from trigonometric functions definitions:
We have,
\[x=r\cdot \cos \theta \] And \[y=r\cdot \sin \theta \]
So we have that,
\[{{r}^{2}}={{x}^{2}}+{{y}^{2}}\]
And by using trigonometric identity, i.e.
\[\cos \left( 2\theta \right)={{\cos }^{2}}\theta -{{\sin }^{2}}\theta \]
Again, we can write that;
As, \[x=r\cdot \cos \theta ,\ then\ \Rightarrow \cos \theta =\dfrac{x}{r}\]
And, \[y=r\cdot \sin \theta ,\ then\ \Rightarrow \sin \theta =\dfrac{y}{r}\]
Substituting the above values, we get
\[\cos \left( 2\theta \right)={{\cos }^{2}}\theta -{{\sin }^{2}}\theta ={{\left( \dfrac{x}{r} \right)}^{2}}-{{\left( \dfrac{y}{r} \right)}^{2}}\]
So, therefore
\[\Rightarrow r=\sqrt{\cos \left( 2\cdot \theta \right)}\]
Transposing square root to the left side of the above expression, we get
\[\Rightarrow {{r}^{2}}=\cos \left( 2\cdot \theta \right)\]
Substituting the value of \[\cos \left( 2\theta \right)\] in the above expression, we get
\[\Rightarrow {{r}^{2}}={{\left( \dfrac{x}{r} \right)}^{2}}-{{\left( \dfrac{y}{r} \right)}^{2}}\]
Simplifying the above expression, we get
\[\Rightarrow {{r}^{2}}=\dfrac{{{x}^{2}}-{{y}^{2}}}{{{r}^{2}}}\]
Multiply both the sides of the equation by\[{{r}^{2}}\], we get
\[\Rightarrow {{r}^{4}}={{x}^{2}}-{{y}^{2}}\]
Simplifying the exponents in the above expression, we get
\[\Rightarrow {{\left( {{r}^{2}} \right)}^{2}}={{x}^{2}}-{{y}^{2}}\]
Substituting the value of \[{{r}^{2}}={{x}^{2}}+{{y}^{2}}\] in the above expression, we get
\[\Rightarrow {{\left( {{x}^{2}}+{{y}^{2}} \right)}^{2}}={{x}^{2}}-{{y}^{2}}\]
Thus,
The graph of the equation\[{{\left( {{x}^{2}}+{{y}^{2}} \right)}^{2}}={{x}^{2}}-{{y}^{2}}\];
Hence, this is the required graph.
Note:
Students need to remember that polar coordinates are those coordinates that can be plotted into a circular grid. On the other side, rectangular coordinates are those coordinates that can be plotted into a plane i.e. graph and the rectangular coordinates are represented in the form of (x, y). Rectangular coordinates include only numerical values as they represent only horizontal axis and vertical axis.
Recently Updated Pages
Master Class 12 Economics: Engaging Questions & Answers for Success
Master Class 12 Physics: Engaging Questions & Answers for Success
Master Class 12 English: Engaging Questions & Answers for Success
Master Class 12 Social Science: Engaging Questions & Answers for Success
Master Class 12 Maths: Engaging Questions & Answers for Success
Master Class 12 Business Studies: Engaging Questions & Answers for Success
Trending doubts
Which are the Top 10 Largest Countries of the World?
What are the major means of transport Explain each class 12 social science CBSE
Draw a labelled sketch of the human eye class 12 physics CBSE
Differentiate between insitu conservation and exsitu class 12 biology CBSE
Draw a neat and well labeled diagram of TS of ovary class 12 biology CBSE
Differentiate between homogeneous and heterogeneous class 12 chemistry CBSE