


How do you graph $r = 1 - \sin \left( \theta \right)$ ?
Answer
591.6k+ views
Hint:The given expression is $r = 1 - \sin \left( \theta \right)$ which produces a cardioid. In the given expression $r = 1 - \sin \left( \theta \right)$ try to substitute different values for $\theta $ and find the corresponding values of $r$ and plot the graph for the same values.
Complete step by step answer:
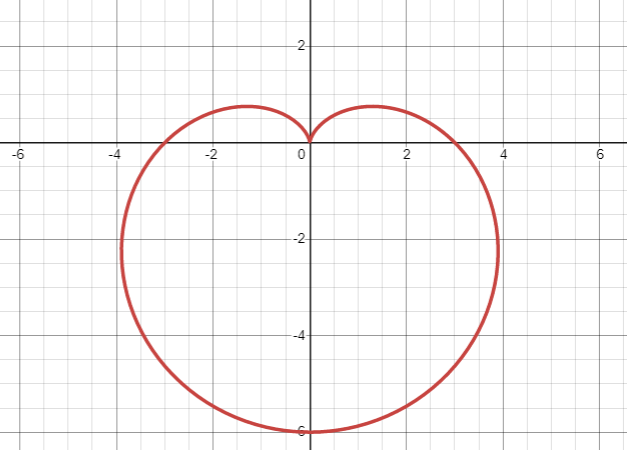
The given expression that is $r = 1 - \sin \left( \theta \right)$ which is a polar coordinate produces the cardioid. Cardioid is nothing but a curve or a graph that somewhat looks like a heart-shaped curve.
The graph of a cardioid looks as shown below.
Now, to draw a graph for $r = 1 - \sin \left( \theta \right)$ , try to substitute different values for $\theta $ which varies from $0$ to $2\pi $.
The below table gives us the values of sine function for different values:
$\begin{array}{*{20}{c}}
\theta &{{0^ \circ }}&{{{30}^ \circ }}&{{{45}^ \circ }}&{{{60}^ \circ }}&{{{90}^ \circ }}&{{{180}^ \circ }}&{{{270}^ \circ }}&{{{360}^ \circ }} \\
{\sin \theta }&0&{\dfrac{1}{2}}&{\dfrac{{\sqrt 2 }}{2}}&{\dfrac{1}{2}}&1&0&{ - 1}&0
\end{array}$
Now we consider different values for $\theta $ to which we need to find the corresponding values of $r$ .
So let $\theta = 0$ now to find the corresponding value of $r$ we can write as below,
$ \Rightarrow r = 1 - \sin \left( {{0^ \circ }} \right) = 1 - 0 = 1$
At $\theta = {30^ \circ }$ the value of $r$ is
$ \Rightarrow r = 1 - \sin \left( {{{30}^ \circ }} \right) = 1 - \dfrac{1}{2} = \dfrac{1}{2}$
At $\theta = {60^ \circ }$ the value of $r$ is
$ \Rightarrow r = 1 - \sin \left( {{{30}^ \circ }} \right) = 1 - \dfrac{1}{2} = \dfrac{1}{2}$
At $\theta = {90^ \circ }$ the value of $r$ we get as
$ \Rightarrow r = 1 - \sin \left( {{{90}^ \circ }} \right) = 1 - 1 = 0$
In the same way the values of $r$ can be listed as below for different values of $\theta $ .
\[\begin{array}{*{20}{c}}
\theta &{{0^ \circ }}&{{{30}^ \circ }}&{{{60}^ \circ }}&{{{90}^ \circ }}&{{{180}^ \circ }}&{{{270}^ \circ }}&{{{360}^ \circ }} \\
r&1&{\dfrac{1}{2}}&{\dfrac{1}{2}}&0&1&2&1
\end{array}\]
Now, plot the graph for the above values. Which is shown as in the below figure.
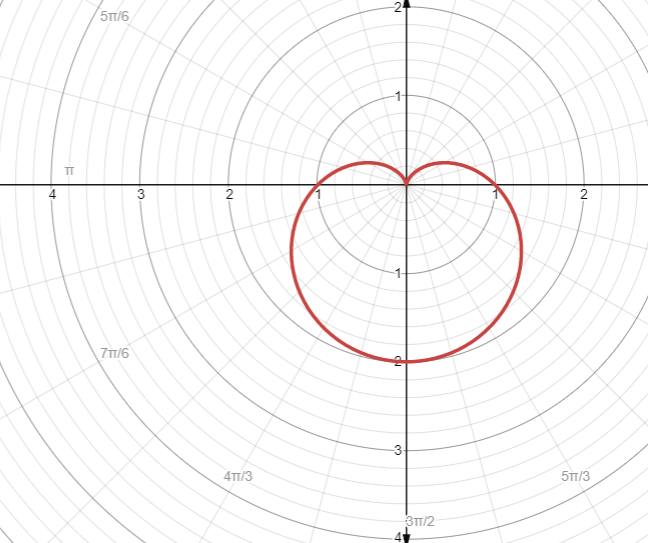
Therefore, the graph for the given expression $r = 1 - \sin \left( \theta \right)$ is as shown in the above figure.
Note: Whenever they ask us to draw a graph by giving an equation, then just take some values for one unknown that is for $\theta $ in the given equation and find the corresponding values of another unknown that is $r$ in this problem. Plot the same on a graph sheet as we did above.
Complete step by step answer:
The given expression that is $r = 1 - \sin \left( \theta \right)$ which is a polar coordinate produces the cardioid. Cardioid is nothing but a curve or a graph that somewhat looks like a heart-shaped curve.
The graph of a cardioid looks as shown below.
Now, to draw a graph for $r = 1 - \sin \left( \theta \right)$ , try to substitute different values for $\theta $ which varies from $0$ to $2\pi $.
The below table gives us the values of sine function for different values:
$\begin{array}{*{20}{c}}
\theta &{{0^ \circ }}&{{{30}^ \circ }}&{{{45}^ \circ }}&{{{60}^ \circ }}&{{{90}^ \circ }}&{{{180}^ \circ }}&{{{270}^ \circ }}&{{{360}^ \circ }} \\
{\sin \theta }&0&{\dfrac{1}{2}}&{\dfrac{{\sqrt 2 }}{2}}&{\dfrac{1}{2}}&1&0&{ - 1}&0
\end{array}$
Now we consider different values for $\theta $ to which we need to find the corresponding values of $r$ .
So let $\theta = 0$ now to find the corresponding value of $r$ we can write as below,
$ \Rightarrow r = 1 - \sin \left( {{0^ \circ }} \right) = 1 - 0 = 1$
At $\theta = {30^ \circ }$ the value of $r$ is
$ \Rightarrow r = 1 - \sin \left( {{{30}^ \circ }} \right) = 1 - \dfrac{1}{2} = \dfrac{1}{2}$
At $\theta = {60^ \circ }$ the value of $r$ is
$ \Rightarrow r = 1 - \sin \left( {{{30}^ \circ }} \right) = 1 - \dfrac{1}{2} = \dfrac{1}{2}$
At $\theta = {90^ \circ }$ the value of $r$ we get as
$ \Rightarrow r = 1 - \sin \left( {{{90}^ \circ }} \right) = 1 - 1 = 0$
In the same way the values of $r$ can be listed as below for different values of $\theta $ .
\[\begin{array}{*{20}{c}}
\theta &{{0^ \circ }}&{{{30}^ \circ }}&{{{60}^ \circ }}&{{{90}^ \circ }}&{{{180}^ \circ }}&{{{270}^ \circ }}&{{{360}^ \circ }} \\
r&1&{\dfrac{1}{2}}&{\dfrac{1}{2}}&0&1&2&1
\end{array}\]
Now, plot the graph for the above values. Which is shown as in the below figure.
Therefore, the graph for the given expression $r = 1 - \sin \left( \theta \right)$ is as shown in the above figure.
Note: Whenever they ask us to draw a graph by giving an equation, then just take some values for one unknown that is for $\theta $ in the given equation and find the corresponding values of another unknown that is $r$ in this problem. Plot the same on a graph sheet as we did above.
Recently Updated Pages
Master Class 12 Economics: Engaging Questions & Answers for Success
Master Class 12 English: Engaging Questions & Answers for Success
Master Class 12 Social Science: Engaging Questions & Answers for Success
Master Class 12 Maths: Engaging Questions & Answers for Success
Master Class 12 Physics: Engaging Questions & Answers for Success
Master Class 11 Social Science: Engaging Questions & Answers for Success
Trending doubts
One Metric ton is equal to kg A 10000 B 1000 C 100 class 11 physics CBSE
Difference Between Prokaryotic Cells and Eukaryotic Cells
Find the value of the expression given below sin 30circ class 11 maths CBSE
Two of the body parts which do not appear in MRI are class 11 biology CBSE
1 ton equals to A 100 kg B 1000 kg C 10 kg D 10000 class 11 physics CBSE
Draw a diagram of nephron and explain its structur class 11 biology CBSE