


How do you graph \[\left( 3,5 \right)\] on a coordinate graph?
Answer
555.3k+ views
Hint: For the given question we are given to plot a graph for a point \[\left( 3,5 \right)\]. As we know every point on a coordinate graph contains abscissa and ordinate in which we have to mark abscissa at horizontal distance and ordinate at vertical distance of axis.
Complete step-by-step solution:
For the given problem we are given to plot a coordinate graph for \[\left( 3,5 \right)\]. For that let us consider given as a point X.
\[X=\left( 3,5 \right)\]
For (x, y) as we know that x represents the abscissa and refers to the horizontal axis (x) and y represents the ordinate which refers to the vertical axis (y) of a standard two dimensional graph.
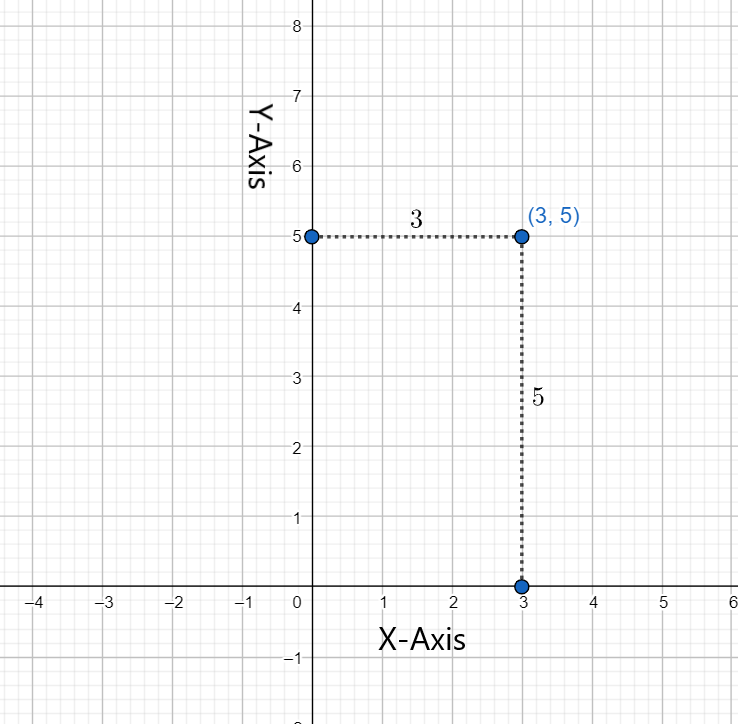
The 3 of a point \[X\] is the signed measure of its projection on the primary axis, whose absolute distance between the projection and the origin of the axis, and whose sign is given by the location of projection relative to the origin.
The 5 of a point\[X\] is the signed measure of its projection on the secondary axis, whose absolute value is the distance between the projection and the origin of the axis, and whose sign is given by the location on the projection relative to the origin.
Therefore coordinate graph is
Note: If the given point is like \[\left( -x,-y \right)\] then the point will be plotted at quadrant-4 because as we know that sign of abscissa and ordinate represents the location of the point. Negative abscissa represents the opposite of location of positive abscissa as well as negative ordinate too.
Complete step-by-step solution:
For the given problem we are given to plot a coordinate graph for \[\left( 3,5 \right)\]. For that let us consider given as a point X.
\[X=\left( 3,5 \right)\]
For (x, y) as we know that x represents the abscissa and refers to the horizontal axis (x) and y represents the ordinate which refers to the vertical axis (y) of a standard two dimensional graph.
The 3 of a point \[X\] is the signed measure of its projection on the primary axis, whose absolute distance between the projection and the origin of the axis, and whose sign is given by the location of projection relative to the origin.
The 5 of a point\[X\] is the signed measure of its projection on the secondary axis, whose absolute value is the distance between the projection and the origin of the axis, and whose sign is given by the location on the projection relative to the origin.
Therefore coordinate graph is
Note: If the given point is like \[\left( -x,-y \right)\] then the point will be plotted at quadrant-4 because as we know that sign of abscissa and ordinate represents the location of the point. Negative abscissa represents the opposite of location of positive abscissa as well as negative ordinate too.
Recently Updated Pages
Master Class 9 General Knowledge: Engaging Questions & Answers for Success
Master Class 9 Social Science: Engaging Questions & Answers for Success
Master Class 9 English: Engaging Questions & Answers for Success
Master Class 9 Maths: Engaging Questions & Answers for Success
Master Class 9 Science: Engaging Questions & Answers for Success
Class 9 Question and Answer - Your Ultimate Solutions Guide
Trending doubts
Difference Between Plant Cell and Animal Cell
Fill the blanks with the suitable prepositions 1 The class 9 english CBSE
Who is eligible for RTE class 9 social science CBSE
Which places in India experience sunrise first and class 9 social science CBSE
What is pollution? How many types of pollution? Define it
Name 10 Living and Non living things class 9 biology CBSE