


How do you graph $f(x) = - 5x - 1$ by plotting points?
Answer
546.3k+ views
Hint: In the given question an equation is given to draw a graph by plotting points. Note that the above equation is in the form of an equation of straight line which is given by $y = mx + c$, where m is the slope of the line and c is a constant. We substitute different values of x and obtain the values of y. Then we plot the points $(x,y)$ in the x-y plane and we will have a required graph of the given equation.
Complete step by step solution:
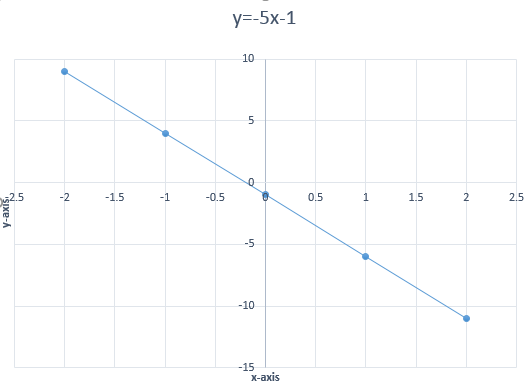
Given an equation of the form $f(x) = - 5x - 1$.
Note that the given equation needs to be solved which is in the form of a linear equation.
The above equation is in the form of an equation of a straight line.
The general form of an equation of a straight line is given by $y = mx + c$,
Where m denotes the slope of the line and c is a constant.
So write the above equation as,
$y = - 5x - 1$ …… (1)
Comparing with the general equation of a straight line we get,
$m = - 5$ and $c = - 1$.
Now to draw a graph of a linear equation, we first assume some values for the variable x and substitute in the above equation and obtain the values of the other variable y.
Then plotting these values of x and y on the x-y plane, we get the graph of the given equation.
We first let different values of x.
Substituting $x = 0$ in the equation (1), we have,
$y = - 5(0) - 1$
$ \Rightarrow y = - 1$
Therefore, for $x = 0$ we have $y = - 1$.
Substituting $x = 1$ in the equation (1), we have,
$y = - 5(1) - 1$
$ \Rightarrow y = - 6$
Therefore, for $x = 1$ we have $y = - 6$.
Substituting $x = 2$ in the equation (2), we have,
$y = - 5(2) - 1$
$ \Rightarrow y = - 11$
Therefore, for $x = 2$ we have $y = - 11$.
Substituting $x = - 1$ in the equation (1), we have,
$y = - 5( - 1) - 1$
$ \Rightarrow y = 4$
Therefore, for $x = - 1$ we have $y = 4$.
Substituting $x = - 2$ in the equation (1), we have,
$y = - 5( - 2) - 1$
$ \Rightarrow y = 9$
Therefore, for $x = - 2$ we have $y = 9$.
Note :
Graph of a linear equation is always a straight line. Remember the general form of an equation of a straight line given by $y = mx + c$, where m is the slope of the line and c is a constant.
If while calculating points, if someone has made a mistake then all the points obtained after calculations will not come on a straight line. So, we need to calculate carefully while doing calculations for points and also while plotting in x-y plane.
Complete step by step solution:
Given an equation of the form $f(x) = - 5x - 1$.
Note that the given equation needs to be solved which is in the form of a linear equation.
The above equation is in the form of an equation of a straight line.
The general form of an equation of a straight line is given by $y = mx + c$,
Where m denotes the slope of the line and c is a constant.
So write the above equation as,
$y = - 5x - 1$ …… (1)
Comparing with the general equation of a straight line we get,
$m = - 5$ and $c = - 1$.
Now to draw a graph of a linear equation, we first assume some values for the variable x and substitute in the above equation and obtain the values of the other variable y.
Then plotting these values of x and y on the x-y plane, we get the graph of the given equation.
We first let different values of x.
Substituting $x = 0$ in the equation (1), we have,
$y = - 5(0) - 1$
$ \Rightarrow y = - 1$
Therefore, for $x = 0$ we have $y = - 1$.
Substituting $x = 1$ in the equation (1), we have,
$y = - 5(1) - 1$
$ \Rightarrow y = - 6$
Therefore, for $x = 1$ we have $y = - 6$.
Substituting $x = 2$ in the equation (2), we have,
$y = - 5(2) - 1$
$ \Rightarrow y = - 11$
Therefore, for $x = 2$ we have $y = - 11$.
Substituting $x = - 1$ in the equation (1), we have,
$y = - 5( - 1) - 1$
$ \Rightarrow y = 4$
Therefore, for $x = - 1$ we have $y = 4$.
Substituting $x = - 2$ in the equation (1), we have,
$y = - 5( - 2) - 1$
$ \Rightarrow y = 9$
Therefore, for $x = - 2$ we have $y = 9$.
| x | -2 | -1 | 0 | 1 | 2 |
| y | 9 | 4 | -1 | -6 | -11 |
Note :
Graph of a linear equation is always a straight line. Remember the general form of an equation of a straight line given by $y = mx + c$, where m is the slope of the line and c is a constant.
If while calculating points, if someone has made a mistake then all the points obtained after calculations will not come on a straight line. So, we need to calculate carefully while doing calculations for points and also while plotting in x-y plane.
Recently Updated Pages
Master Class 11 Computer Science: Engaging Questions & Answers for Success
Master Class 11 Business Studies: Engaging Questions & Answers for Success
Master Class 11 Economics: Engaging Questions & Answers for Success
Master Class 11 English: Engaging Questions & Answers for Success
Master Class 11 Maths: Engaging Questions & Answers for Success
Master Class 11 Biology: Engaging Questions & Answers for Success
Trending doubts
One Metric ton is equal to kg A 10000 B 1000 C 100 class 11 physics CBSE
There are 720 permutations of the digits 1 2 3 4 5 class 11 maths CBSE
Discuss the various forms of bacteria class 11 biology CBSE
Draw a diagram of a plant cell and label at least eight class 11 biology CBSE
State the laws of reflection of light
Explain zero factorial class 11 maths CBSE