


How do you graph for \[y=3\cos \left( x-\dfrac{\pi }{3} \right)\]?
Answer
563.1k+ views
Hint: Assume $y=\cos x$ as the reference function. Now, compare the given function \[y=3\cos \left( x-\dfrac{\pi }{3} \right)\] with the general form: \[y=a\cos \left[ b\left( x+c \right) \right]+d\]. Find the corresponding values of a, b, c and d and using these values find the vertical compression or stretch (a), also known as the amplitude, horizontal compression or stretch (b), horizontal shift (c) also known as the phase shift, and vertical shift (d) of the function. Using the information obtained, draw the graph of the given function.
Complete step by step answer:
Here, we have been provided with the function \[y=3\cos \left( x-\dfrac{\pi }{3} \right)\] and we are asked to draw its graph. As we can see that here the cosine function is slightly different from $y=\cos x$ which is assumed as the reference function. So its graph will also be shifted slightly.
Now, the general form of the cosine function is given as \[y=a\cos \left[ b\left( x+c \right) \right]+d\]. Here, we have the vertical compression or stretch (a) also known as the amplitude, horizontal compression or stretch (b), horizontal shift (c) also known as the phase shift, and vertical shift (d) of the function. The descriptions for this transform are:
1. If \[\left| a \right|>1\] then vertical stretch takes place and if 0 < a < 1 then vertical compression takes place.
2. If ‘a’ is negative then the function is reflected about the x – axis.
3. If \[\left| b \right|>1\] then horizontal stretch takes place and if 0 < b < 1 then horizontal compression takes place.
4. If ‘b’ is negative then the function is reflected about y – axis.
5. If ‘c’ is negative then the function is shifted \[\left| c \right|\] units to the right and if ‘c’ is positive then the function is shifted \[\left| c \right|\] units to the left.
6. If ‘d’ is negative then the function is shifted \[\left| d \right|\] units down and if ‘d’ is positive then the function is shifted \[\left| d \right|\] units up.
Now, on comparing the given function \[y=3\cos \left( x-\dfrac{\pi }{3} \right)\] with the general form \[y=a\cos \left[ b\left( x+c \right) \right]+d\] we have,
\[\Rightarrow a=3,b=1,c=-\dfrac{\pi }{3}\] and $d=0$.
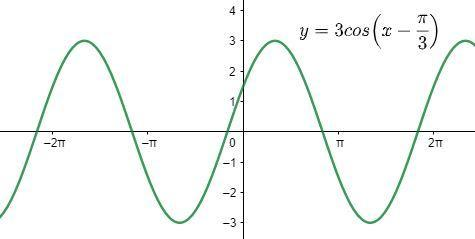
Therefore, the graph will have a vertical stretch of 3 units from the mean position. The function will be shifted \[\dfrac{\pi }{3}\] units to the right and there will not be any vertical shifting and horizontal stretching.
Now, let us draw the graph of the function.
Note: You must remember the descriptions of the transform of the function otherwise it will be difficult to draw the graph. Note that the phase shift has no effect on time period. Time period changes only when the coefficient of x is changed in the function. These graphs are helpful in chapters like ‘Area under curve’ in which we need to find the limits of the integral.
Complete step by step answer:
Here, we have been provided with the function \[y=3\cos \left( x-\dfrac{\pi }{3} \right)\] and we are asked to draw its graph. As we can see that here the cosine function is slightly different from $y=\cos x$ which is assumed as the reference function. So its graph will also be shifted slightly.
Now, the general form of the cosine function is given as \[y=a\cos \left[ b\left( x+c \right) \right]+d\]. Here, we have the vertical compression or stretch (a) also known as the amplitude, horizontal compression or stretch (b), horizontal shift (c) also known as the phase shift, and vertical shift (d) of the function. The descriptions for this transform are:
1. If \[\left| a \right|>1\] then vertical stretch takes place and if 0 < a < 1 then vertical compression takes place.
2. If ‘a’ is negative then the function is reflected about the x – axis.
3. If \[\left| b \right|>1\] then horizontal stretch takes place and if 0 < b < 1 then horizontal compression takes place.
4. If ‘b’ is negative then the function is reflected about y – axis.
5. If ‘c’ is negative then the function is shifted \[\left| c \right|\] units to the right and if ‘c’ is positive then the function is shifted \[\left| c \right|\] units to the left.
6. If ‘d’ is negative then the function is shifted \[\left| d \right|\] units down and if ‘d’ is positive then the function is shifted \[\left| d \right|\] units up.
Now, on comparing the given function \[y=3\cos \left( x-\dfrac{\pi }{3} \right)\] with the general form \[y=a\cos \left[ b\left( x+c \right) \right]+d\] we have,
\[\Rightarrow a=3,b=1,c=-\dfrac{\pi }{3}\] and $d=0$.
Therefore, the graph will have a vertical stretch of 3 units from the mean position. The function will be shifted \[\dfrac{\pi }{3}\] units to the right and there will not be any vertical shifting and horizontal stretching.
Now, let us draw the graph of the function.
Note: You must remember the descriptions of the transform of the function otherwise it will be difficult to draw the graph. Note that the phase shift has no effect on time period. Time period changes only when the coefficient of x is changed in the function. These graphs are helpful in chapters like ‘Area under curve’ in which we need to find the limits of the integral.
Recently Updated Pages
Master Class 11 Social Science: Engaging Questions & Answers for Success
Master Class 11 English: Engaging Questions & Answers for Success
Master Class 11 Maths: Engaging Questions & Answers for Success
Master Class 11 Chemistry: Engaging Questions & Answers for Success
Master Class 11 Biology: Engaging Questions & Answers for Success
Master Class 11 Physics: Engaging Questions & Answers for Success
Trending doubts
One Metric ton is equal to kg A 10000 B 1000 C 100 class 11 physics CBSE
Difference Between Prokaryotic Cells and Eukaryotic Cells
How many of the following diseases can be studied with class 11 biology CBSE
Which of the following enzymes is used for carboxylation class 11 biology CBSE
Draw a diagram of a plant cell and label at least eight class 11 biology CBSE
Two of the body parts which do not appear in MRI are class 11 biology CBSE