


How do you graph \[f\left( x \right)={{\log }_{3}}\left( x-1 \right)\] ?
Answer
551.7k+ views
Hint: These types of problems are pretty straight forward and are very easy to solve. For problems like these we need to remember some of the concepts like functions, graph theory and origin transformations. In the given problem what we need to do is first transform the origin from the normal coordinate system to another defined system. After that we need to plot the graph in the new coordinate system. Doing so, we need to return back to our previous coordinate system to get the required graph in our original x-y coordinate system.
Complete step by step answer:
Now we start off with our solution and we first try to do an origin transformation of our given function. We are initially given,
\[y={{\log }_{3}}\left( x-1 \right)\]
Now, we transform the origin in such a way that,
\[Y={{\log }_{3}}\left( X \right)\] , where \[X=x-1,Y=y\]
So what we have done basically is, shifted the origin towards the right by one unit. Now we plot the graph of \[Y={{\log }_{3}}\left( X \right)\] . This is a very standard graph with an asymptote at \[X=0\] and equates to value \[0\] at \[X=1\] . We plot this graph.
Now what we do is go back to our original x-y coordinate system by reversing the transformation, which is,
\[x=X+1,y=Y\]
This basically means that we shift the new coordinate system towards the left without any shift in the plotted graph.
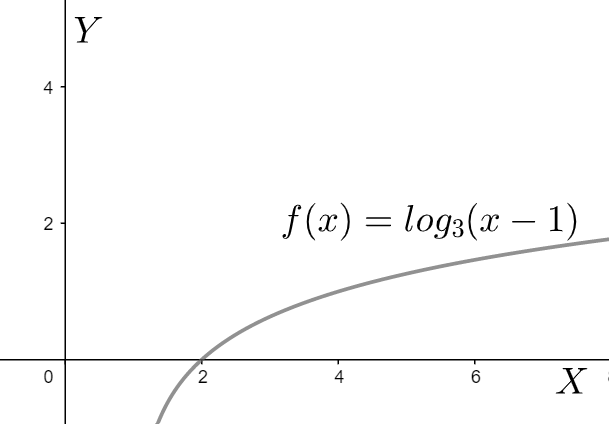
Thus, the asymptote becomes at the line \[x=1\] and the function equates to value \[0\] at \[x=2\] .
Note:
For such types of problems, we need to be very thorough in terms of graphs and functions, and the shifting of axis and graphs. While plotting the graph of any function, we first need to analyse for any possible asymptotes and then look for any \[0\] values. We must also keep in mind and be very careful about the points of discontinuity and non-differentiability.
Complete step by step answer:
Now we start off with our solution and we first try to do an origin transformation of our given function. We are initially given,
\[y={{\log }_{3}}\left( x-1 \right)\]
Now, we transform the origin in such a way that,
\[Y={{\log }_{3}}\left( X \right)\] , where \[X=x-1,Y=y\]
So what we have done basically is, shifted the origin towards the right by one unit. Now we plot the graph of \[Y={{\log }_{3}}\left( X \right)\] . This is a very standard graph with an asymptote at \[X=0\] and equates to value \[0\] at \[X=1\] . We plot this graph.
Now what we do is go back to our original x-y coordinate system by reversing the transformation, which is,
\[x=X+1,y=Y\]
This basically means that we shift the new coordinate system towards the left without any shift in the plotted graph.
Thus, the asymptote becomes at the line \[x=1\] and the function equates to value \[0\] at \[x=2\] .
Note:
For such types of problems, we need to be very thorough in terms of graphs and functions, and the shifting of axis and graphs. While plotting the graph of any function, we first need to analyse for any possible asymptotes and then look for any \[0\] values. We must also keep in mind and be very careful about the points of discontinuity and non-differentiability.
Recently Updated Pages
Master Class 11 English: Engaging Questions & Answers for Success
Master Class 11 Maths: Engaging Questions & Answers for Success
Master Class 11 Biology: Engaging Questions & Answers for Success
Master Class 11 Social Science: Engaging Questions & Answers for Success
Master Class 11 Physics: Engaging Questions & Answers for Success
Master Class 11 Accountancy: Engaging Questions & Answers for Success
Trending doubts
One Metric ton is equal to kg A 10000 B 1000 C 100 class 11 physics CBSE
There are 720 permutations of the digits 1 2 3 4 5 class 11 maths CBSE
Discuss the various forms of bacteria class 11 biology CBSE
Draw a diagram of a plant cell and label at least eight class 11 biology CBSE
State the laws of reflection of light
Explain zero factorial class 11 maths CBSE