


How do you graph \[f\left( x \right) = \dfrac{1}{x}\] ?
Answer
478.5k+ views
Hint: In the above given question, we are given a function of the variable \[x\] which is defined as \[f\left( x \right) = \dfrac{1}{x}\] . We have to plot the graph of the above given function. In order to approach the solution, we have to find a few initial coordinates that lie on the graph of \[f\left( x \right) = \dfrac{1}{x}\] . Thus, by plotting these points and tracing the obtained path, we can draw the required graph of \[f\left( x \right) = \dfrac{1}{x}\].
Complete step by step answer:
Given function is,
\[ \Rightarrow f\left( x \right) = \dfrac{1}{x}\]
We have to plot the graph for this function. As we can see that the given function is not defined for the value \[x = 0\] because the value of the function at \[0\] is \[f\left( 0 \right) = \dfrac{1}{0}\] which is undefined.Hence, we have to plot the graph of \[f\left( x \right)\] for \[x \ne 0\] i.e. for \[x > 0\] and \[x < 0\] separately.
Now, for \[x > 0\] taking initial coordinates as,
Similarly, for \[x < 0\] taking initial coordinates as,
Now, plotting these three pairs of coordinates separately will provide us two different curves.
These two curves define the graph of the same function \[f\left( x \right) = \dfrac{1}{x}\] for the positive and negative values of \[x\]. Therefore, the required graph of the above given function \[f\left( x \right) = \dfrac{1}{x}\] can be represented by the curves drawn below.
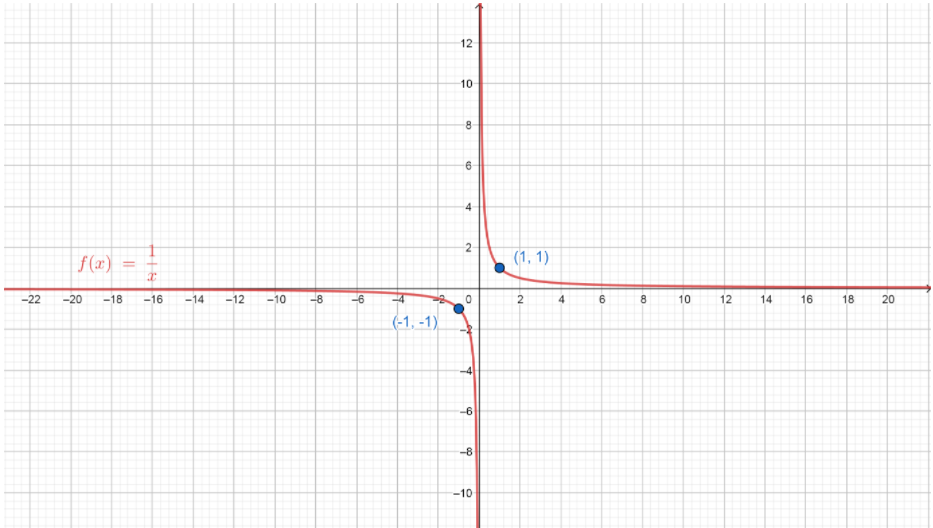
From the graph we can observe that for very high values of \[x\] the value of the function \[f\left( x \right) = \dfrac{1}{x}\] is almost equal/closest to zero (but never actually zero for a real number \[x\] ).Also, lower the value of \[x\] , higher the value is for \[f\left( x \right)\].
Note:From the above graph, we can notice the increasing and decreasing nature of the function \[f\left( x \right) = \dfrac{1}{x}\] . The given function is strictly increasing in the interval \[\left( {0,1} \right)\] and \[\left( { - \infty ,1} \right)\] and also strictly decreasing in the interval \[\left( {1,\infty } \right)\] and \[\left( { - 1,0} \right)\].
Complete step by step answer:
Given function is,
\[ \Rightarrow f\left( x \right) = \dfrac{1}{x}\]
We have to plot the graph for this function. As we can see that the given function is not defined for the value \[x = 0\] because the value of the function at \[0\] is \[f\left( 0 \right) = \dfrac{1}{0}\] which is undefined.Hence, we have to plot the graph of \[f\left( x \right)\] for \[x \ne 0\] i.e. for \[x > 0\] and \[x < 0\] separately.
Now, for \[x > 0\] taking initial coordinates as,
| \[x\] | \[1\] | \[2\] | \[\dfrac{1}{2}\] |
| \[y\] | \[1\] | \[\dfrac{1}{2}\] | \[2\] |
Similarly, for \[x < 0\] taking initial coordinates as,
| \[x\] | \[ - 1\] | \[ - 2\] | \[ - \dfrac{1}{2}\] |
| \[y\] | \[ - 1\] | \[ - \dfrac{1}{2}\] | \[ - 2\] |
Now, plotting these three pairs of coordinates separately will provide us two different curves.
These two curves define the graph of the same function \[f\left( x \right) = \dfrac{1}{x}\] for the positive and negative values of \[x\]. Therefore, the required graph of the above given function \[f\left( x \right) = \dfrac{1}{x}\] can be represented by the curves drawn below.
From the graph we can observe that for very high values of \[x\] the value of the function \[f\left( x \right) = \dfrac{1}{x}\] is almost equal/closest to zero (but never actually zero for a real number \[x\] ).Also, lower the value of \[x\] , higher the value is for \[f\left( x \right)\].
Note:From the above graph, we can notice the increasing and decreasing nature of the function \[f\left( x \right) = \dfrac{1}{x}\] . The given function is strictly increasing in the interval \[\left( {0,1} \right)\] and \[\left( { - \infty ,1} \right)\] and also strictly decreasing in the interval \[\left( {1,\infty } \right)\] and \[\left( { - 1,0} \right)\].

Recently Updated Pages
Master Class 11 English: Engaging Questions & Answers for Success
Master Class 11 Maths: Engaging Questions & Answers for Success
Master Class 11 Biology: Engaging Questions & Answers for Success
Master Class 11 Social Science: Engaging Questions & Answers for Success
Master Class 11 Physics: Engaging Questions & Answers for Success
Master Class 11 Accountancy: Engaging Questions & Answers for Success
Trending doubts
Difference Between Plant Cell and Animal Cell
Fill the blanks with the suitable prepositions 1 The class 9 english CBSE
Which places in India experience sunrise first and class 9 social science CBSE
What is pollution? How many types of pollution? Define it
Name 10 Living and Non living things class 9 biology CBSE
What is the full form of pH?