


How do you graph \[\dfrac{{{{\left( {y + 1} \right)}^2}}}{{36}} - \dfrac{{{{\left( {x + 5} \right)}^2}}}{9} = 1\] ?
Answer
586.5k+ views
Hint: Here in this question, we have to plot the graph of the given equation. The given equation represent the standard equation for a hyperbola with a vertical transverse axis i.e., \[\dfrac{{{{\left( {y - k} \right)}^2}}}{{{a^2}}} - \dfrac{{{{\left( {x - h} \right)}^2}}}{{{b^2}}} = 1\] , we have to find the centre, vertices, Foci, eccentricity and asymptotes of given equation and later plot the graph using the vertices and centre.
Complete step by step solution:
A hyperbola is the set of all points such that the difference of the distances between any point on the hyperbola and two fixed points is constant. The two fixed points are called the foci of the hyperbola.
The standard equation for a hyperbola with a vertical transverse axis is \[\dfrac{{{{\left( {y - k} \right)}^2}}}{{{a^2}}} - \dfrac{{{{\left( {x - h} \right)}^2}}}{{{b^2}}} = 1\] . The centre is at \[\left( {h,k} \right)\] and vertices is \[\left( {h,{\text{ }}k{\text{ + }}a} \right)\] and \[\left( {h,{\text{ }}k - a} \right)\] . The distance between the vertices is \[2a\] . Foci is \[\left( {h,{\text{ }}k + c} \right)\] and \[\left( {h,{\text{ }}k - c} \right)\] The distance between the foci is \[2c\] . \[{c^2} = {a^2} + {b^2}\] .
A hyperbola with a vertical transverse axis and centre at \[\left( {h,k} \right)\] has one asymptote with equation \[y = k + \dfrac{a}{b}\left( {x - h} \right)\] and the other with equation \[y = k - \dfrac{a}{b}\left( {x - h} \right)\] .
The eccentricity of a hyperbola, like an ellipse, is \[e = \dfrac{c}{a}\] . For all hyperbolas, though, \[c > a\] , so \[e > 1\] . if \[e\] is close to one, the branches of the hyperbola are very narrow, but if \[e\] is much greater than one, then the branches of the hyperbola are very flat.
Now, consider the given equation: \[\dfrac{{{{\left( {y + 1} \right)}^2}}}{{36}} - \dfrac{{{{\left( {x + 5} \right)}^2}}}{9} = 1\]
Or
\[\dfrac{{{{\left( {y + 1} \right)}^2}}}{{{6^2}}} - \dfrac{{{{\left( {x + 5} \right)}^2}}}{{{9^2}}} = 1\]
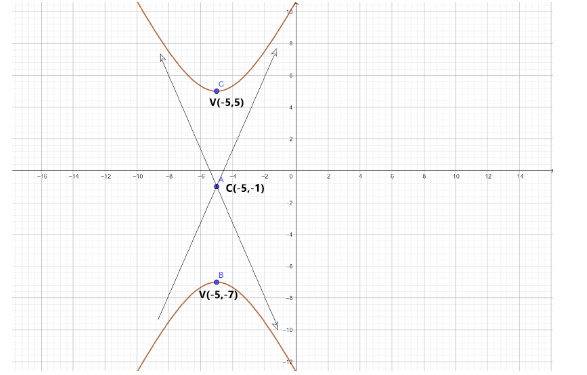
Centre: \[\left( {h,k} \right) = \left( { - 5, - 1} \right)\]
Vertices: \[\left( {h,{\text{ }}k{\text{ + }}a} \right) = \left( { - 5, - 1 + 6} \right) = \left( { - 5,5} \right)\] and
\[\left( {h,{\text{ }}k - a} \right) = \left( { - 5, - 1 - 6} \right) = \left( { - 5, - 7} \right)\]
\[ \Rightarrow c = \sqrt {{a^2} + {b^2}} \]
\[ \Rightarrow c = \sqrt {36 + 9} \]
\[ \Rightarrow c = \sqrt {45} = \sqrt {9 \times 5} \]
\[ \Rightarrow c = 3\sqrt 5 \]
Foci: \[\left( {h,{\text{ }}k + c} \right) = \left( { - 5, - 1 + 3\sqrt 5 } \right)\] and
\[\left( {h,{\text{ }}k - c} \right) = \left( { - 5, - 1 - 3\sqrt 5 } \right)\]
Eccentricity: \[e = \dfrac{c}{a}\]
\[ \Rightarrow e = \dfrac{{3\sqrt 5 }}{6}\]
\[ \Rightarrow e = \dfrac{{\sqrt 5 }}{2}\]
Asymptotes: \[y = k + \dfrac{a}{b}\left( {x - h} \right) = - 1 + \dfrac{6}{3}\left( {x - \left( { - 5} \right)} \right)\]
\[ \Rightarrow y = - 1 + 2\left( {x + 5} \right)\]
\[ \Rightarrow y = - 1 + 2x + 10\]
\[ \Rightarrow y = 2x + 9\]
And
\[y = k - \dfrac{a}{b}\left( {x - h} \right) = - 1 - \dfrac{6}{3}\left( {x - \left( { - 5} \right)} \right)\]
\[ \Rightarrow y = - 1 - 2\left( {x + 5} \right)\]
\[ \Rightarrow y = - 1 - 2x - 10\]
\[ \Rightarrow y = - 2x - 11\]
The graphical representation is:
Note: The plotting of a graph is different here. When we plot the graph for the hyperbola and ellipse we use different methods. Here in this question we determine the values of centre, vertices, foci, eccentricity and asymptotes and finally we obtain the linear equation for y and hence we can plot the graph.
Complete step by step solution:
A hyperbola is the set of all points such that the difference of the distances between any point on the hyperbola and two fixed points is constant. The two fixed points are called the foci of the hyperbola.
The standard equation for a hyperbola with a vertical transverse axis is \[\dfrac{{{{\left( {y - k} \right)}^2}}}{{{a^2}}} - \dfrac{{{{\left( {x - h} \right)}^2}}}{{{b^2}}} = 1\] . The centre is at \[\left( {h,k} \right)\] and vertices is \[\left( {h,{\text{ }}k{\text{ + }}a} \right)\] and \[\left( {h,{\text{ }}k - a} \right)\] . The distance between the vertices is \[2a\] . Foci is \[\left( {h,{\text{ }}k + c} \right)\] and \[\left( {h,{\text{ }}k - c} \right)\] The distance between the foci is \[2c\] . \[{c^2} = {a^2} + {b^2}\] .
A hyperbola with a vertical transverse axis and centre at \[\left( {h,k} \right)\] has one asymptote with equation \[y = k + \dfrac{a}{b}\left( {x - h} \right)\] and the other with equation \[y = k - \dfrac{a}{b}\left( {x - h} \right)\] .
The eccentricity of a hyperbola, like an ellipse, is \[e = \dfrac{c}{a}\] . For all hyperbolas, though, \[c > a\] , so \[e > 1\] . if \[e\] is close to one, the branches of the hyperbola are very narrow, but if \[e\] is much greater than one, then the branches of the hyperbola are very flat.
Now, consider the given equation: \[\dfrac{{{{\left( {y + 1} \right)}^2}}}{{36}} - \dfrac{{{{\left( {x + 5} \right)}^2}}}{9} = 1\]
Or
\[\dfrac{{{{\left( {y + 1} \right)}^2}}}{{{6^2}}} - \dfrac{{{{\left( {x + 5} \right)}^2}}}{{{9^2}}} = 1\]
Centre: \[\left( {h,k} \right) = \left( { - 5, - 1} \right)\]
Vertices: \[\left( {h,{\text{ }}k{\text{ + }}a} \right) = \left( { - 5, - 1 + 6} \right) = \left( { - 5,5} \right)\] and
\[\left( {h,{\text{ }}k - a} \right) = \left( { - 5, - 1 - 6} \right) = \left( { - 5, - 7} \right)\]
\[ \Rightarrow c = \sqrt {{a^2} + {b^2}} \]
\[ \Rightarrow c = \sqrt {36 + 9} \]
\[ \Rightarrow c = \sqrt {45} = \sqrt {9 \times 5} \]
\[ \Rightarrow c = 3\sqrt 5 \]
Foci: \[\left( {h,{\text{ }}k + c} \right) = \left( { - 5, - 1 + 3\sqrt 5 } \right)\] and
\[\left( {h,{\text{ }}k - c} \right) = \left( { - 5, - 1 - 3\sqrt 5 } \right)\]
Eccentricity: \[e = \dfrac{c}{a}\]
\[ \Rightarrow e = \dfrac{{3\sqrt 5 }}{6}\]
\[ \Rightarrow e = \dfrac{{\sqrt 5 }}{2}\]
Asymptotes: \[y = k + \dfrac{a}{b}\left( {x - h} \right) = - 1 + \dfrac{6}{3}\left( {x - \left( { - 5} \right)} \right)\]
\[ \Rightarrow y = - 1 + 2\left( {x + 5} \right)\]
\[ \Rightarrow y = - 1 + 2x + 10\]
\[ \Rightarrow y = 2x + 9\]
And
\[y = k - \dfrac{a}{b}\left( {x - h} \right) = - 1 - \dfrac{6}{3}\left( {x - \left( { - 5} \right)} \right)\]
\[ \Rightarrow y = - 1 - 2\left( {x + 5} \right)\]
\[ \Rightarrow y = - 1 - 2x - 10\]
\[ \Rightarrow y = - 2x - 11\]
The graphical representation is:
Note: The plotting of a graph is different here. When we plot the graph for the hyperbola and ellipse we use different methods. Here in this question we determine the values of centre, vertices, foci, eccentricity and asymptotes and finally we obtain the linear equation for y and hence we can plot the graph.
Recently Updated Pages
Basicity of sulphurous acid and sulphuric acid are
Master Class 11 English: Engaging Questions & Answers for Success
Master Class 11 Physics: Engaging Questions & Answers for Success
Master Class 11 Computer Science: Engaging Questions & Answers for Success
Master Class 11 Chemistry: Engaging Questions & Answers for Success
Master Class 11 Social Science: Engaging Questions & Answers for Success
Trending doubts
Difference Between Prokaryotic Cells and Eukaryotic Cells
Two of the body parts which do not appear in MRI are class 11 biology CBSE
One Metric ton is equal to kg A 10000 B 1000 C 100 class 11 physics CBSE
10 examples of friction in our daily life
Draw a diagram of nephron and explain its structur class 11 biology CBSE
What will happen if the mucus is not secreted by the class 11 biology CBSE