


How do you graph by using zeros for $ f\left( x \right) = 3{x^3} - 15{x^2} + 18x $ ?
Answer
581.7k+ views
Hint: Zeros of a polynomial are the values of the variable, when substituted we get the polynomial equal to zero. Equate the given function to zero and find out the points where f(x) is equal to zero. These points are the x-intercepts that will help us plot the graph.
Complete step by step solution:
Let us first understand what we mean by zero a polynomial function.
Suppose, we have a polynomial function $ y = f\left( x \right) $ , where f is a function in x. Then the zero of the polynomial f(x) are those values of x for which the value of y or f(x) is equal to zero.
i.e. $ f\left( x \right) = 0 $
In other words, zeros of a polynomial are the values of the variable, when substituted we get the polynomial equal to zero.
The given function is $ f\left( x \right) = 3{x^3} - 15{x^2} + 18x $ .
Now, equate this function to zero
i.e. $ f\left( x \right) = 3{x^3} - 15{x^2} + 18x - - - - - - - - - - - \left( 1 \right) $
We can simplify the equation by taking out x common from all the terms in the above equation. So, we get, $ f\left( x \right) = x\left( {3{x^2} - 15x + 18} \right) $
We can also take out $ 3 $ common from all the terms inside the bracket as all the coefficients of the quadratic expression inside the bracket are divisible by $ 3 $ .
So, we have, \[f\left( x \right) = 3x\left( {{x^2} - 5x + 6} \right)\]
Now, we can factorise the quadratic using splitting the middle term method,
\[f\left( x \right) = 3x\left( {{x^2} - 3x - 2x + 6} \right)\]
So, we split the middle term $ 5x $ into $ 3x $ and $ 2x $ .
\[ \Rightarrow f\left( x \right) = 3x\left( {x\left( {x - 3} \right) - 2\left( {x - 3} \right)} \right)\]
\[ \Rightarrow f\left( x \right) = 3x\left( {x - 3} \right)\left( {x - 2} \right)\]
Now, equating $ f\left( x \right) = 0 $ so as to find the zeros of the function.
Either $ x = 0 $ or $ x = 2 $ or $ x = 3 $
Finally, we get that the function f(x) is equal to zero for $ x = 0 $ , $ x = 2 $ or $ x = 3 $ .
These zeroes help in plotting the graph of the polynomial function. Actually, these zeroes nothing but the x intercepts of the function. This means zeroes are the points where the curve of the function meets the x-axis.
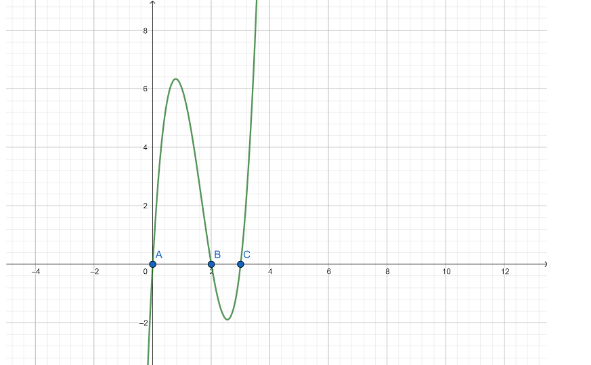
Therefore, the curve of the given function meets the x-axis at $ x = 0 $ , $ x = 2 $ and $ x = 3 $ .
Note: Note that just knowing the zeroes or x-intercepts of a polynomial function is not sufficient in plotting the graph of the function. We need more points to draw the graph such as the y-intercept, the points where the curve takes a turn. You may employ other methods such as completing the square method or quadratic formula to solve a quadratic equation.
Complete step by step solution:
Let us first understand what we mean by zero a polynomial function.
Suppose, we have a polynomial function $ y = f\left( x \right) $ , where f is a function in x. Then the zero of the polynomial f(x) are those values of x for which the value of y or f(x) is equal to zero.
i.e. $ f\left( x \right) = 0 $
In other words, zeros of a polynomial are the values of the variable, when substituted we get the polynomial equal to zero.
The given function is $ f\left( x \right) = 3{x^3} - 15{x^2} + 18x $ .
Now, equate this function to zero
i.e. $ f\left( x \right) = 3{x^3} - 15{x^2} + 18x - - - - - - - - - - - \left( 1 \right) $
We can simplify the equation by taking out x common from all the terms in the above equation. So, we get, $ f\left( x \right) = x\left( {3{x^2} - 15x + 18} \right) $
We can also take out $ 3 $ common from all the terms inside the bracket as all the coefficients of the quadratic expression inside the bracket are divisible by $ 3 $ .
So, we have, \[f\left( x \right) = 3x\left( {{x^2} - 5x + 6} \right)\]
Now, we can factorise the quadratic using splitting the middle term method,
\[f\left( x \right) = 3x\left( {{x^2} - 3x - 2x + 6} \right)\]
So, we split the middle term $ 5x $ into $ 3x $ and $ 2x $ .
\[ \Rightarrow f\left( x \right) = 3x\left( {x\left( {x - 3} \right) - 2\left( {x - 3} \right)} \right)\]
\[ \Rightarrow f\left( x \right) = 3x\left( {x - 3} \right)\left( {x - 2} \right)\]
Now, equating $ f\left( x \right) = 0 $ so as to find the zeros of the function.
Either $ x = 0 $ or $ x = 2 $ or $ x = 3 $
Finally, we get that the function f(x) is equal to zero for $ x = 0 $ , $ x = 2 $ or $ x = 3 $ .
These zeroes help in plotting the graph of the polynomial function. Actually, these zeroes nothing but the x intercepts of the function. This means zeroes are the points where the curve of the function meets the x-axis.
Therefore, the curve of the given function meets the x-axis at $ x = 0 $ , $ x = 2 $ and $ x = 3 $ .
Note: Note that just knowing the zeroes or x-intercepts of a polynomial function is not sufficient in plotting the graph of the function. We need more points to draw the graph such as the y-intercept, the points where the curve takes a turn. You may employ other methods such as completing the square method or quadratic formula to solve a quadratic equation.

Recently Updated Pages
Basicity of sulphurous acid and sulphuric acid are
Master Class 12 Economics: Engaging Questions & Answers for Success
Master Class 12 Biology: Engaging Questions & Answers for Success
Master Class 11 English: Engaging Questions & Answers for Success
Master Class 11 Physics: Engaging Questions & Answers for Success
Master Class 11 Computer Science: Engaging Questions & Answers for Success
Trending doubts
Difference Between Plant Cell and Animal Cell
Fill the blanks with the suitable prepositions 1 The class 9 english CBSE
What is pollution? How many types of pollution? Define it
What is the full form of pH?
What is the Full Form of ICSE, CBSE and SSC
Name 10 Living and Non living things class 9 biology CBSE