


How do you graph and list the amplitude, period, phase shift for $ y = - \sin \left( {x - \pi } \right) $ ?
Answer
530.7k+ views
Hint: First, using the suitable trigonometric identities, simplify the given equation and try to get a simplest form of the equation so that we can understand it better. Then find the maximum value of the function.
Complete step by step solution:
The given equation is $ y = - \sin \left( {x - \pi } \right) - - - - - - - - - \left( 1 \right) $
This is a trigonometric equation. All trigonometric functions are periodic. This means that the function repeats itself after a regular interval on the Cartesian plane.
The trigonometric function $ \sin x $ has a period of $ 2\pi $ radians. This means that the values of the function $ \sin x $ repeat after every interval of $ 2\pi $ radians.
This helps in graphing the curve of a trigonometric function. We can graph the function for an interval of $ 2\pi $ radians and then just replicate the function for every such successive interval.
Let us simplify equation $ 1 $ by using the identity $ - \sin \theta = \sin \left( { - \theta } \right) $ .
Then,
$ \Rightarrow y = - \sin \left( {x - \pi } \right) $
$ \Rightarrow y = \sin \left[ { - \left( {x - \pi } \right)} \right] $
$ \Rightarrow y = \sin \left( {\pi - x} \right) $
Now, we shall use the identity $ \sin \left( {\pi - x} \right) = \sin x $
So, we get, $ y = - \sin \left( {x - \pi } \right) = \sin x $
This means that the graph of equation $ \left( 1 \right) $ is the same as the graph of trigonometric function $ \sin x $ .
So, we get the graph of $ y = - \sin \left( {x - \pi } \right) $ as
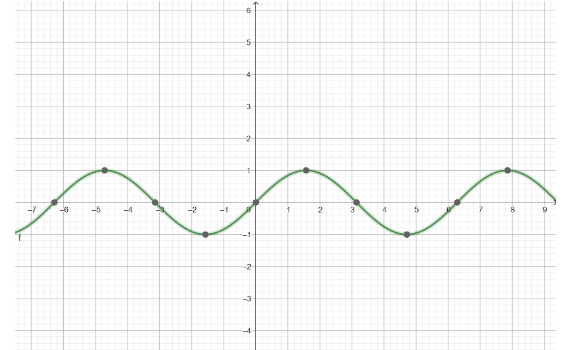
So, we now know that $ y = - \sin \left( {x - \pi } \right) = \sin x $
Hence, the maximum value of the function $ y = - \sin \left( {x - \pi } \right) $ is $ 1 $ .
Therefore, the amplitude of the function $ y = - \sin \left( {x - \pi } \right) $ is $ 1 $ .
Period of the function $ y = - \sin \left( {x - \pi } \right) $ is $ 2\pi $ radians.
Phase shift of the graph is zero.
Note: If we have an equation $ A\sin \left( {kx - \phi } \right) $ , then A is the amplitude, $ \dfrac{{2\pi }}{k} $ is the period and $ \phi $ is the phase shift of the graph.
Here, in this case, $ A = 1 $ , $ k = 1 $ and $ \phi = 0 $ .
This means that amplitude of the function is $ 1 $ , period is $ 2\pi $ and phase shift is zero.
Complete step by step solution:
The given equation is $ y = - \sin \left( {x - \pi } \right) - - - - - - - - - \left( 1 \right) $
This is a trigonometric equation. All trigonometric functions are periodic. This means that the function repeats itself after a regular interval on the Cartesian plane.
The trigonometric function $ \sin x $ has a period of $ 2\pi $ radians. This means that the values of the function $ \sin x $ repeat after every interval of $ 2\pi $ radians.
This helps in graphing the curve of a trigonometric function. We can graph the function for an interval of $ 2\pi $ radians and then just replicate the function for every such successive interval.
Let us simplify equation $ 1 $ by using the identity $ - \sin \theta = \sin \left( { - \theta } \right) $ .
Then,
$ \Rightarrow y = - \sin \left( {x - \pi } \right) $
$ \Rightarrow y = \sin \left[ { - \left( {x - \pi } \right)} \right] $
$ \Rightarrow y = \sin \left( {\pi - x} \right) $
Now, we shall use the identity $ \sin \left( {\pi - x} \right) = \sin x $
So, we get, $ y = - \sin \left( {x - \pi } \right) = \sin x $
This means that the graph of equation $ \left( 1 \right) $ is the same as the graph of trigonometric function $ \sin x $ .
So, we get the graph of $ y = - \sin \left( {x - \pi } \right) $ as
So, we now know that $ y = - \sin \left( {x - \pi } \right) = \sin x $
Hence, the maximum value of the function $ y = - \sin \left( {x - \pi } \right) $ is $ 1 $ .
Therefore, the amplitude of the function $ y = - \sin \left( {x - \pi } \right) $ is $ 1 $ .
Period of the function $ y = - \sin \left( {x - \pi } \right) $ is $ 2\pi $ radians.
Phase shift of the graph is zero.
Note: If we have an equation $ A\sin \left( {kx - \phi } \right) $ , then A is the amplitude, $ \dfrac{{2\pi }}{k} $ is the period and $ \phi $ is the phase shift of the graph.
Here, in this case, $ A = 1 $ , $ k = 1 $ and $ \phi = 0 $ .
This means that amplitude of the function is $ 1 $ , period is $ 2\pi $ and phase shift is zero.
Recently Updated Pages
Master Class 11 Computer Science: Engaging Questions & Answers for Success
Master Class 11 Business Studies: Engaging Questions & Answers for Success
Master Class 11 Economics: Engaging Questions & Answers for Success
Master Class 11 English: Engaging Questions & Answers for Success
Master Class 11 Maths: Engaging Questions & Answers for Success
Master Class 11 Biology: Engaging Questions & Answers for Success
Trending doubts
One Metric ton is equal to kg A 10000 B 1000 C 100 class 11 physics CBSE
There are 720 permutations of the digits 1 2 3 4 5 class 11 maths CBSE
Discuss the various forms of bacteria class 11 biology CBSE
Draw a diagram of a plant cell and label at least eight class 11 biology CBSE
State the laws of reflection of light
Explain zero factorial class 11 maths CBSE