


How to graph a parabola $y = \dfrac{1}{2}{(x - 3)^2} + 5$?
Answer
558k+ views
Hint: In this question, we have an equation and we are supposed to plot a graph after solving it. This can be done when the correct points are found which will be only possible if a table of calculations is made and the values are calculated in order to solve the equation.
Complete step by step answer:
Construct a data table with input $x$ and corresponding values for $y$:
This table will help immensely in understanding the End Behaviour of the given
Function: $y = \dfrac{1}{2}{(x - 3)^2} + 5$
$x: - 5 \leqslant x \leqslant 5$[ Col 1]
Draw graphs for $y = {x^2},y = {(x - 3)^2},y = (\dfrac{1}{2}){(x - 3)^2}$and finally $y = (\dfrac{1}{2}){(x - 3)^2} + 5$
Find Vertices, $x$-intercept and $y$-intercept, if any, for all the graphs.
Step 2
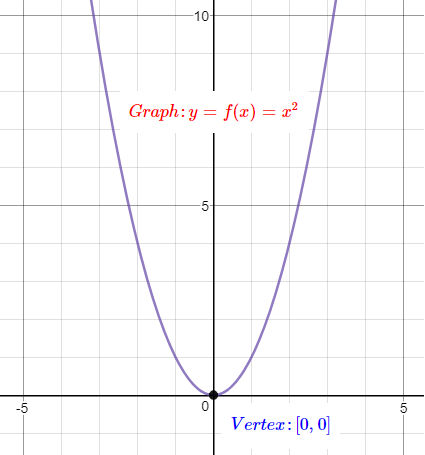
Graph: $y = {x^2}$.....Parent Quadratic Function
Step 3
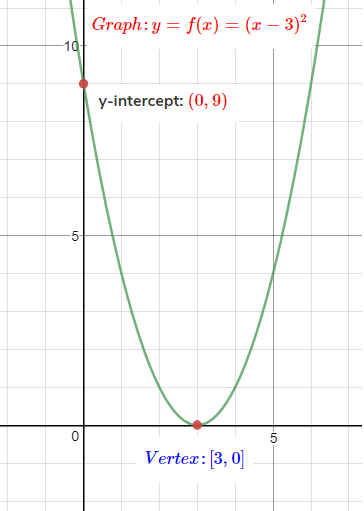
Graph: $y = {(x - 3)^2}$
Step 4
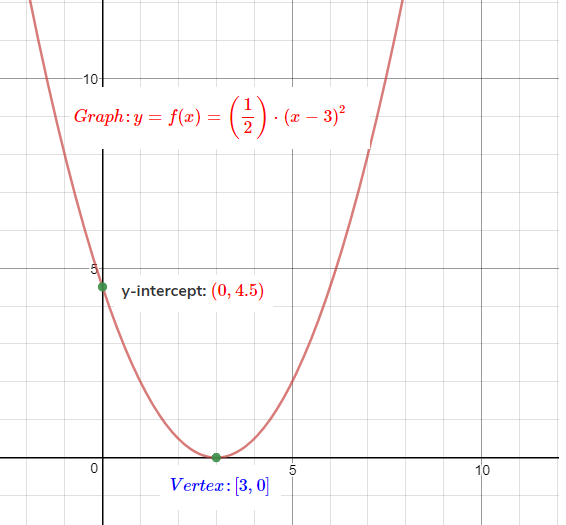
Graph: $y = \left( {\dfrac{1}{2}} \right){(x - 3)^2}$
Step 5
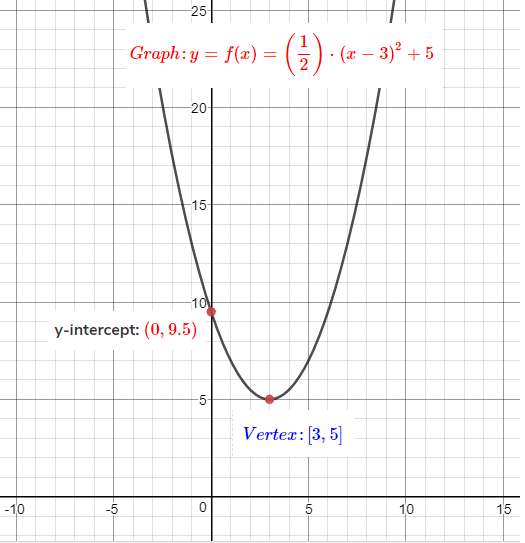
Graph: $y = (\dfrac{1}{2}){(x - 3)^2} + 5$
And the last step is to view all the graphs together.
$y = fx = \left( {\dfrac{1}{2}} \right){(x - 3)^2} + 5$
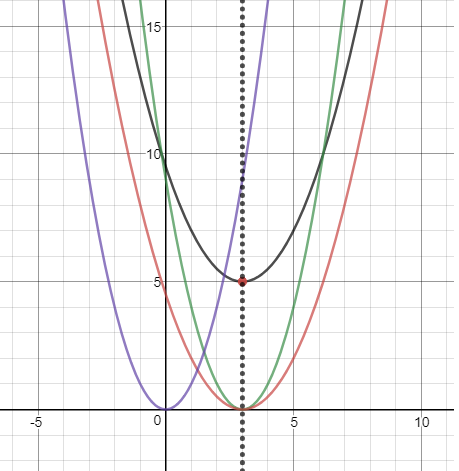
General form: $y = f(x) = a{(x - h)^2} + k,$ Vertex: \[(a,h)\]
Graph opens up, as the ${x^2}$ term is positive.
Parabolic curve is expanded outward, as $0 < a < 1$
$x = h$ and in our problem $x = 3$ is the Axis of Symmetry
$h = 3$ Indicates the Horizontal Shift
$k = 5$ Indicates the Vertical Shift
Note: The graph of a quadratic function is a U-shaped curve called a parabola. The sign on the coefficient a of the quadratic function affects whether the graph opens up or down. If $a < 0$, the graph makes a frown (opens down) and if $a > 0$then the graph makes a smile (opens up).
Complete step by step answer:
Construct a data table with input $x$ and corresponding values for $y$:
This table will help immensely in understanding the End Behaviour of the given
Function: $y = \dfrac{1}{2}{(x - 3)^2} + 5$
| $x$ | $y = {x^2}$ | $y = {(x - 3)^2}$ | $y = \left( {\dfrac{1}{2}} \right){(x - 3)^2}$ | $y = (\dfrac{1}{2}){(x - 3)^2} + 5$ |
| Col 1 | Col 2 | Col 3 | Col 4 | Col 5 |
| -5 | 25 | 64 | 32.0 | 37.0 |
| -4 | 16 | 49 | 24.5 | 29.5 |
| -3 | 9 | 36 | 18.0 | 23.0 |
| -2 | 4 | 25 | 12.5 | 17.5 |
| -1 | 1 | 16 | 8.5 | 13.0 |
| 0 | 0 | 9 | 4.5 | 9.5 |
| 1 | 1 | 4 | 2.0 | 7.0 |
| 2 | 4 | 1 | 0.5 | 5.5 |
| 3 | 9 | 0 | 0.0 | 5.0 |
| 4 | 16 | 1 | 0.5 | 5.5 |
| 5 | 25 | 4 | 2.0 | 7.0 |
$x: - 5 \leqslant x \leqslant 5$[ Col 1]
Draw graphs for $y = {x^2},y = {(x - 3)^2},y = (\dfrac{1}{2}){(x - 3)^2}$and finally $y = (\dfrac{1}{2}){(x - 3)^2} + 5$
Find Vertices, $x$-intercept and $y$-intercept, if any, for all the graphs.
Step 2
Graph: $y = {x^2}$.....Parent Quadratic Function
Step 3
Graph: $y = {(x - 3)^2}$
Step 4
Graph: $y = \left( {\dfrac{1}{2}} \right){(x - 3)^2}$
Step 5
Graph: $y = (\dfrac{1}{2}){(x - 3)^2} + 5$
And the last step is to view all the graphs together.
$y = fx = \left( {\dfrac{1}{2}} \right){(x - 3)^2} + 5$
General form: $y = f(x) = a{(x - h)^2} + k,$ Vertex: \[(a,h)\]
Graph opens up, as the ${x^2}$ term is positive.
Parabolic curve is expanded outward, as $0 < a < 1$
$x = h$ and in our problem $x = 3$ is the Axis of Symmetry
$h = 3$ Indicates the Horizontal Shift
$k = 5$ Indicates the Vertical Shift
Note: The graph of a quadratic function is a U-shaped curve called a parabola. The sign on the coefficient a of the quadratic function affects whether the graph opens up or down. If $a < 0$, the graph makes a frown (opens down) and if $a > 0$then the graph makes a smile (opens up).
Recently Updated Pages
Master Class 11 Computer Science: Engaging Questions & Answers for Success
Master Class 11 Business Studies: Engaging Questions & Answers for Success
Master Class 11 Economics: Engaging Questions & Answers for Success
Master Class 11 English: Engaging Questions & Answers for Success
Master Class 11 Maths: Engaging Questions & Answers for Success
Master Class 11 Biology: Engaging Questions & Answers for Success
Trending doubts
One Metric ton is equal to kg A 10000 B 1000 C 100 class 11 physics CBSE
There are 720 permutations of the digits 1 2 3 4 5 class 11 maths CBSE
Discuss the various forms of bacteria class 11 biology CBSE
Draw a diagram of a plant cell and label at least eight class 11 biology CBSE
State the laws of reflection of light
Explain zero factorial class 11 maths CBSE