


How to graph a parabola $x = {y^2} - 4y + 3?$
Answer
582k+ views
Hint: In this question, we are going to find the values of the parabola and plot the values in the graph.
The given equation is in the quadratic form so equate it to the quadratic formula.
Next use the vertex of the curve and find the value of $y$ and substitute the value of $y$ in the given equation we get the value of $x$.
Find the $x$ and $y$ intercept for the given equation.
Finally, Plot the points on the graph we get the required result.
Complete step by step solution:
In this question, we are going to find the points and then plot the points in the graph.
First write the given equation and mark it as $\left( 1 \right)$
$x = {y^2} - 4y + 3.....\left( 1 \right)$
The given equation is of the parabolic type.
The given equation is of the form $x = a{y^2} + by + c$
Here $a = 1,\,b = - 4,\,c = 3$
The vertex of the curve is given by
$ \Rightarrow y = - \dfrac{b}{{2a}}$
Let us putting the value and we get,
$ \Rightarrow y = - \dfrac{{ - 4}}{{2\left( 1 \right)}}$
On multiply the term and we get,
$ \Rightarrow y = \dfrac{4}{2}$
Let us cancel the term and we get
$ \Rightarrow y = 2$
Now calculate the $x$ coordinate of the vertex.
$ \Rightarrow x = {\left( 2 \right)^2} - 4\left( 2 \right) + 3$
On square the term and we get,
$ \Rightarrow x = 4 - 8 + 3$
Let us simplify the term and we get,
$ \Rightarrow x = - 1$
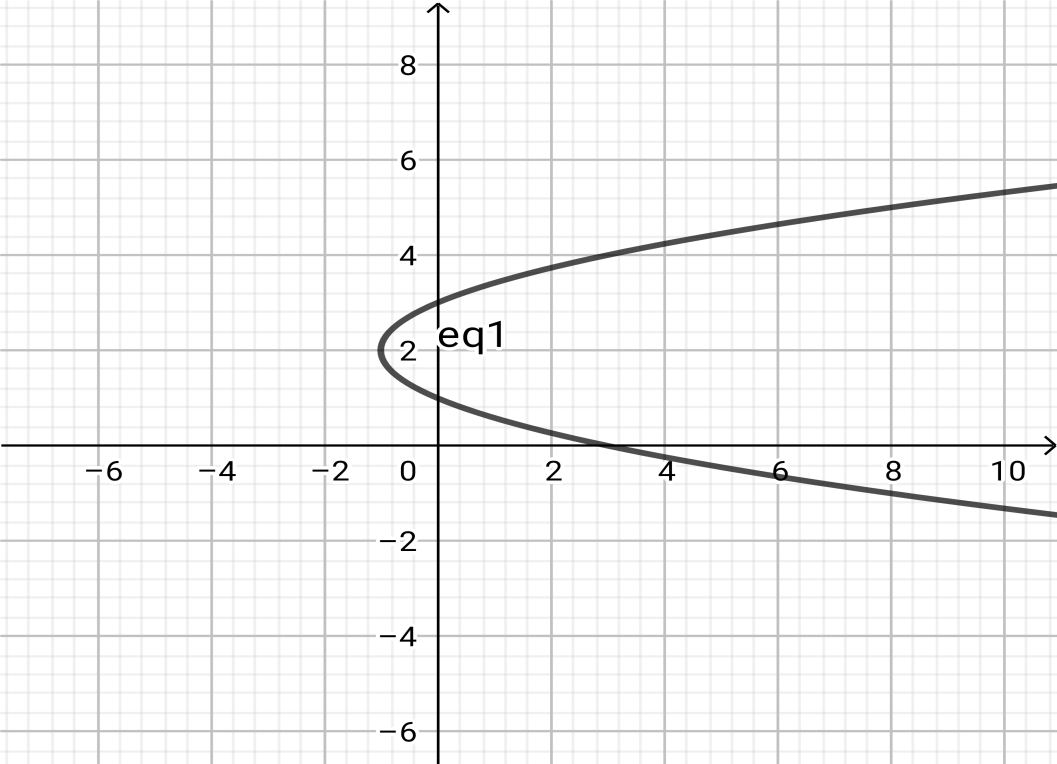
So the vertex is at $\left( { - 1,2} \right)$
The parabola will be either to the right or to the left.
Since the coefficient of $a$ is positive, the parabola opens in the positive direction.
Calculate and plot the $x$ intercept:
$ \Rightarrow x = {y^2} - 4y + 3 = {\left( 0 \right)^2} - 4\left( 0 \right) + 3$
Let us simply the term
$ \Rightarrow x = 3$
The $x$intercept is $\left( {3,0} \right)$
Calculate and plot the $y$ intercept:
$f\left( y \right) = {y^2} - 4y + 3 = 0$
On splitting the terms we get,
$ \Rightarrow {y^2} - y - 3y + 3 = 0$
On rewriting the term and we get
$ \Rightarrow y(y - 1) - 3(y - 1) = 0$
On rewriting we get
$ \Rightarrow (y - 3)(y - 1) = 0$
Let us equating the term and we get
$ \Rightarrow (y - 3) = 0,(y - 1) = 0$
Then we get,
$ \Rightarrow y = 3,y = 1$
The $y$ intercept is $\left( {0,3} \right)\left( {0,1} \right)$
Hence we get the required result.
Draw our $y$-axis as a vertical line and our $x$-axis as a horizontal line
All these are plotted as $\left( {0,1} \right),\left( {0,3} \right),\left( {3,0} \right)$
Graph:
Note: Graphs are a common method to visually illustrate relationships in the data. The purpose of graphs is to present data that are too numerous or complicated to be described adequately in the text and in less space.
Here is how to plot a graph of a function:
Calculate the first derivative
Find all the stationary and critical points
Calculate the second derivative
Find all points where the second derivative is zero.
Create a table of variation by identifying.
The given equation is in the quadratic form so equate it to the quadratic formula.
Next use the vertex of the curve and find the value of $y$ and substitute the value of $y$ in the given equation we get the value of $x$.
Find the $x$ and $y$ intercept for the given equation.
Finally, Plot the points on the graph we get the required result.
Complete step by step solution:
In this question, we are going to find the points and then plot the points in the graph.
First write the given equation and mark it as $\left( 1 \right)$
$x = {y^2} - 4y + 3.....\left( 1 \right)$
The given equation is of the parabolic type.
The given equation is of the form $x = a{y^2} + by + c$
Here $a = 1,\,b = - 4,\,c = 3$
The vertex of the curve is given by
$ \Rightarrow y = - \dfrac{b}{{2a}}$
Let us putting the value and we get,
$ \Rightarrow y = - \dfrac{{ - 4}}{{2\left( 1 \right)}}$
On multiply the term and we get,
$ \Rightarrow y = \dfrac{4}{2}$
Let us cancel the term and we get
$ \Rightarrow y = 2$
Now calculate the $x$ coordinate of the vertex.
$ \Rightarrow x = {\left( 2 \right)^2} - 4\left( 2 \right) + 3$
On square the term and we get,
$ \Rightarrow x = 4 - 8 + 3$
Let us simplify the term and we get,
$ \Rightarrow x = - 1$
So the vertex is at $\left( { - 1,2} \right)$
The parabola will be either to the right or to the left.
Since the coefficient of $a$ is positive, the parabola opens in the positive direction.
Calculate and plot the $x$ intercept:
$ \Rightarrow x = {y^2} - 4y + 3 = {\left( 0 \right)^2} - 4\left( 0 \right) + 3$
Let us simply the term
$ \Rightarrow x = 3$
The $x$intercept is $\left( {3,0} \right)$
Calculate and plot the $y$ intercept:
$f\left( y \right) = {y^2} - 4y + 3 = 0$
On splitting the terms we get,
$ \Rightarrow {y^2} - y - 3y + 3 = 0$
On rewriting the term and we get
$ \Rightarrow y(y - 1) - 3(y - 1) = 0$
On rewriting we get
$ \Rightarrow (y - 3)(y - 1) = 0$
Let us equating the term and we get
$ \Rightarrow (y - 3) = 0,(y - 1) = 0$
Then we get,
$ \Rightarrow y = 3,y = 1$
The $y$ intercept is $\left( {0,3} \right)\left( {0,1} \right)$
Hence we get the required result.
Draw our $y$-axis as a vertical line and our $x$-axis as a horizontal line
All these are plotted as $\left( {0,1} \right),\left( {0,3} \right),\left( {3,0} \right)$
Graph:
Note: Graphs are a common method to visually illustrate relationships in the data. The purpose of graphs is to present data that are too numerous or complicated to be described adequately in the text and in less space.
Here is how to plot a graph of a function:
Calculate the first derivative
Find all the stationary and critical points
Calculate the second derivative
Find all points where the second derivative is zero.
Create a table of variation by identifying.
Recently Updated Pages
Master Class 12 Economics: Engaging Questions & Answers for Success
Master Class 12 English: Engaging Questions & Answers for Success
Master Class 12 Social Science: Engaging Questions & Answers for Success
Master Class 12 Maths: Engaging Questions & Answers for Success
Master Class 12 Physics: Engaging Questions & Answers for Success
Master Class 9 General Knowledge: Engaging Questions & Answers for Success
Trending doubts
One Metric ton is equal to kg A 10000 B 1000 C 100 class 11 physics CBSE
Difference Between Prokaryotic Cells and Eukaryotic Cells
Find the value of the expression given below sin 30circ class 11 maths CBSE
Two of the body parts which do not appear in MRI are class 11 biology CBSE
Draw a diagram of nephron and explain its structur class 11 biology CBSE
10 examples of friction in our daily life