


How do you graph a decimal on a coordinate graph?
Answer
597.6k+ views
Hint: To plot a point we need to have values of x-coordinate and y-coordinate. Let us consider a real decimal point and then plot a graph by drawing X-axis and Y-axis then mark the points on the graph step by step.
Complete step by step answer:
We have to plot a decimal on a coordinate graph.
To plot a point on the graph first we need to draw an axis. Let us draw X axis and Y axis on the graph and mark the units by taking 1 unit for each box. Then we will get
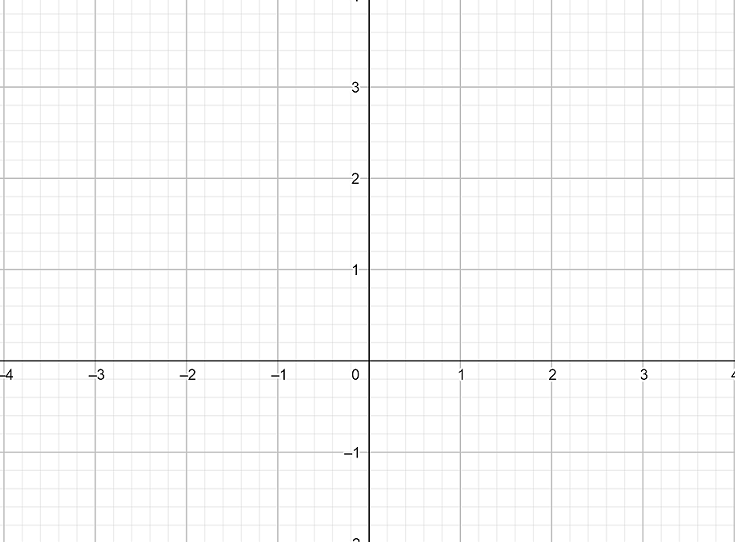
Now, let us consider a point of the form $\left( x,y \right)$ as decimal values $\left( 1.5,2.5 \right)$.
Now, we have a point $\left( 1.5,2.5 \right)$ in which 1.5 is the X-coordinate and 2.5 is the Y-coordinate and both are positive. So, first we move 1.5 places to the right from the origin along the X-axis and then move 2.5 to up and mark the point.
Then we will get
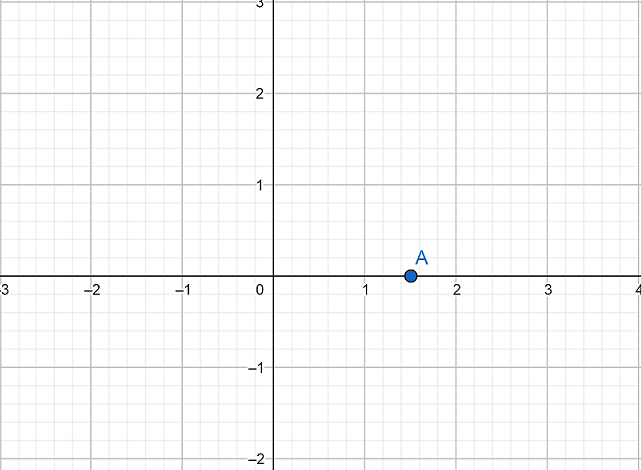
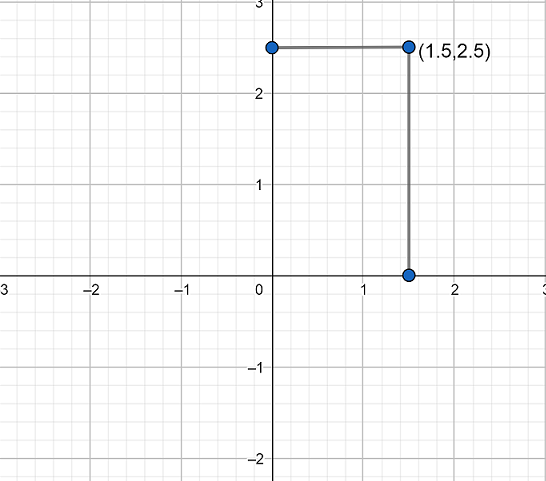
Hence we get the point $\left( 1.5,2.5 \right)$ on the graph.
Note:
Always check the points whether they are positive or negative and draw accordingly. Right hand side from the origin the graph has positive X values and left side has negative X values. Similarly, bottom from the origin has negative Y-values and upward from the origin there is a positive Y-value. If the X-coordinate is zero then the point lies on the Y-axis and when the Y-coordinate is zero the point should lie on the X-axis.
Complete step by step answer:
We have to plot a decimal on a coordinate graph.
To plot a point on the graph first we need to draw an axis. Let us draw X axis and Y axis on the graph and mark the units by taking 1 unit for each box. Then we will get
Now, let us consider a point of the form $\left( x,y \right)$ as decimal values $\left( 1.5,2.5 \right)$.
Now, we have a point $\left( 1.5,2.5 \right)$ in which 1.5 is the X-coordinate and 2.5 is the Y-coordinate and both are positive. So, first we move 1.5 places to the right from the origin along the X-axis and then move 2.5 to up and mark the point.
Then we will get
Hence we get the point $\left( 1.5,2.5 \right)$ on the graph.
Note:
Always check the points whether they are positive or negative and draw accordingly. Right hand side from the origin the graph has positive X values and left side has negative X values. Similarly, bottom from the origin has negative Y-values and upward from the origin there is a positive Y-value. If the X-coordinate is zero then the point lies on the Y-axis and when the Y-coordinate is zero the point should lie on the X-axis.
Recently Updated Pages
Master Class 11 English: Engaging Questions & Answers for Success
Master Class 11 Social Science: Engaging Questions & Answers for Success
Master Class 11 Maths: Engaging Questions & Answers for Success
Master Class 11 Biology: Engaging Questions & Answers for Success
Master Class 11 Physics: Engaging Questions & Answers for Success
Master Class 11 Chemistry: Engaging Questions & Answers for Success