


How do you graph \[4x - 3y = 6\] by plotting points?
Answer
546.3k+ views
Hint: To solve this we need to give the values of ‘x’ and we can find the values of ‘y’. Otherwise we can find the coordinate of the given equation lying on the line of x- axis, we can find this by substituting the value of ‘y’ is equal to zero (x-intercept). Similarly we can find the coordinate of the equation lying on the line of y- axis, we can find this by substituting the value of ‘x’ equal to zero (y-intercept).
Complete step-by-step solution:
Given, \[4x - 3y = 6\].
To find the x-intercept. That is the value of ‘x’ at\[y = 0\]. Substituting this in the given equation. We have,
\[\Rightarrow 4x - 3(0) = 6\]
\[\Rightarrow 4x = 6\]
Divide the whole equating by 4.
\[\Rightarrow x = \dfrac{6}{4}\]
\[\Rightarrow x = \dfrac{3}{2}\].
\[\Rightarrow x = 1.5\]
Thus we have a coordinate of the equation which lies on the line of x-axis. The coordinate is \[(1.5,0)\].
To find the y-intercept. That is the value of ‘y’ at \[x = 0\]. Substituting this in the given equation we have,
\[\Rightarrow 4(0) - 3y = 6\]
\[\Rightarrow - 3y = 6\].
\[\Rightarrow y = - \dfrac{6}{3}\]
\[\Rightarrow y = - 2\]
Thus we have a coordinate of the equation which lies on the line of y-axis. The coordinate is \[(0, - 2)\].
Thus we have the coordinates \[(1.5,0)\] and \[(0, - 2)\].
Let’s plot a graph for this coordinates,
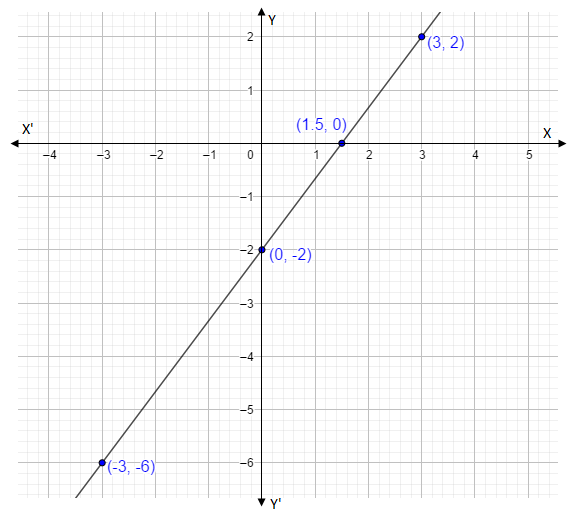
All we did is expand the line touching the coordinates \[(1.5,0)\] and \[(0, - 2)\].
Without doing the calculation we found out two more coordinates. (See in the graph). The coordinates are \[( - 3, - 6)\] and \[(3,2)\].
Note: A graph shows the relation between two variable quantities, it contains two axes perpendicular to each other namely the x-axis and the y-axis. Each variable is measured along one of the axes. In the question, we are given one linear equation containing two variables namely x and y, x is measured along the x-axis and y is measured along the y-axis while tracing the given equations.
Complete step-by-step solution:
Given, \[4x - 3y = 6\].
To find the x-intercept. That is the value of ‘x’ at\[y = 0\]. Substituting this in the given equation. We have,
\[\Rightarrow 4x - 3(0) = 6\]
\[\Rightarrow 4x = 6\]
Divide the whole equating by 4.
\[\Rightarrow x = \dfrac{6}{4}\]
\[\Rightarrow x = \dfrac{3}{2}\].
\[\Rightarrow x = 1.5\]
Thus we have a coordinate of the equation which lies on the line of x-axis. The coordinate is \[(1.5,0)\].
To find the y-intercept. That is the value of ‘y’ at \[x = 0\]. Substituting this in the given equation we have,
\[\Rightarrow 4(0) - 3y = 6\]
\[\Rightarrow - 3y = 6\].
\[\Rightarrow y = - \dfrac{6}{3}\]
\[\Rightarrow y = - 2\]
Thus we have a coordinate of the equation which lies on the line of y-axis. The coordinate is \[(0, - 2)\].
Thus we have the coordinates \[(1.5,0)\] and \[(0, - 2)\].
Let’s plot a graph for this coordinates,
All we did is expand the line touching the coordinates \[(1.5,0)\] and \[(0, - 2)\].
Without doing the calculation we found out two more coordinates. (See in the graph). The coordinates are \[( - 3, - 6)\] and \[(3,2)\].
Note: A graph shows the relation between two variable quantities, it contains two axes perpendicular to each other namely the x-axis and the y-axis. Each variable is measured along one of the axes. In the question, we are given one linear equation containing two variables namely x and y, x is measured along the x-axis and y is measured along the y-axis while tracing the given equations.
Recently Updated Pages
Master Class 11 Computer Science: Engaging Questions & Answers for Success
Master Class 11 Business Studies: Engaging Questions & Answers for Success
Master Class 11 Economics: Engaging Questions & Answers for Success
Master Class 11 English: Engaging Questions & Answers for Success
Master Class 11 Maths: Engaging Questions & Answers for Success
Master Class 11 Biology: Engaging Questions & Answers for Success
Trending doubts
One Metric ton is equal to kg A 10000 B 1000 C 100 class 11 physics CBSE
There are 720 permutations of the digits 1 2 3 4 5 class 11 maths CBSE
Discuss the various forms of bacteria class 11 biology CBSE
Draw a diagram of a plant cell and label at least eight class 11 biology CBSE
State the laws of reflection of light
Explain zero factorial class 11 maths CBSE