


How do you graph 4x + y = – 1 using intercept?
Answer
591.9k+ views
Hint: We are given 4x + y = – 1, we have to sketch the graph of the function. To do so we will learn about the type of the equation and how their graph is differently formed. Once we have that knowledge we will learn our function is a linear function. So we just need 2 or 3 points that satisfy our equation. Since we are asked to find using the intercept so we first learn about intercepts and then form our graph.
Complete step by step answer:
We have to draw the graph of 4x + y = – 1. Before we start our problem, we will learn what type of equation it is and once we have that we will find our graph. The different type of graph has a different approach to find the point and different approach to draw. If our equation is linear then the graph so formed for the linear equation is a straight line. We just have to find any set of the point that satisfies the given equation and then join them, the line obtained will be the required graph. If our equation is quadratic, then for the graph we will need to find the vertex, y – intercept, x – intercept, etc. and then we can find the graph by putting them and then making the graph out of it. Similarly, for other higher equations, a different way is there.
Now, in our equation, 4x + y = – 1, we have x and y are variables and their power is 1. So, we have a linear equation and its graph is a straight line. Now, we have to sketch using intercept, so we understand the intercept and then we find the intercepts. The intercepts are those point of x – axis and y-axis where the function intersect with x – axis and y – axis. The point where the graph touches the x – axis is called x – intercept. The point where the graph touch y-axis is called y-axis. Now to find the x-intercept, we put y = 0 in 4x + y = – 1. So, we get,
\[4\times x+0=-1\]
\[\Rightarrow 4x=-1\]
We get,
\[\Rightarrow x=\dfrac{-1}{4}\]
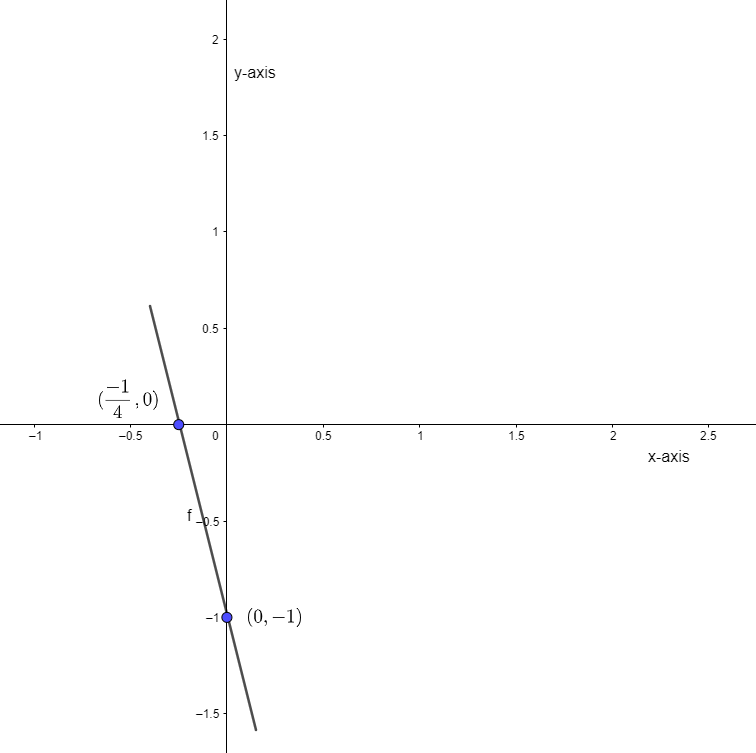
So, the x-intercept is at \[\left( \dfrac{-1}{4},0 \right).\]
For y – intercept, we put x = 0 in our equation, so putting x = 0 in 4x + y = – 1, we get,
\[\Rightarrow 4\times 0+y=-1\]
\[\Rightarrow 0+y=-1\]
\[\Rightarrow y=-1\]
Hence y-intercept is at (0, – 1).
Now, we will put these values on the graph and join them, then the line obtained is our required graph of 4x + y = – 1.
Note: While solving the problem, we need to be careful with the calculation part like 6 – 2y = 4, here we cannot say 2y = 4 – 6, we need to see that 2y has ‘–‘ in front of it, so we need to remove it and also we should know dividing a positive term by negative term will always give us a negative term.
Complete step by step answer:
We have to draw the graph of 4x + y = – 1. Before we start our problem, we will learn what type of equation it is and once we have that we will find our graph. The different type of graph has a different approach to find the point and different approach to draw. If our equation is linear then the graph so formed for the linear equation is a straight line. We just have to find any set of the point that satisfies the given equation and then join them, the line obtained will be the required graph. If our equation is quadratic, then for the graph we will need to find the vertex, y – intercept, x – intercept, etc. and then we can find the graph by putting them and then making the graph out of it. Similarly, for other higher equations, a different way is there.
Now, in our equation, 4x + y = – 1, we have x and y are variables and their power is 1. So, we have a linear equation and its graph is a straight line. Now, we have to sketch using intercept, so we understand the intercept and then we find the intercepts. The intercepts are those point of x – axis and y-axis where the function intersect with x – axis and y – axis. The point where the graph touches the x – axis is called x – intercept. The point where the graph touch y-axis is called y-axis. Now to find the x-intercept, we put y = 0 in 4x + y = – 1. So, we get,
\[4\times x+0=-1\]
\[\Rightarrow 4x=-1\]
We get,
\[\Rightarrow x=\dfrac{-1}{4}\]
So, the x-intercept is at \[\left( \dfrac{-1}{4},0 \right).\]
For y – intercept, we put x = 0 in our equation, so putting x = 0 in 4x + y = – 1, we get,
\[\Rightarrow 4\times 0+y=-1\]
\[\Rightarrow 0+y=-1\]
\[\Rightarrow y=-1\]
Hence y-intercept is at (0, – 1).
Now, we will put these values on the graph and join them, then the line obtained is our required graph of 4x + y = – 1.
Note: While solving the problem, we need to be careful with the calculation part like 6 – 2y = 4, here we cannot say 2y = 4 – 6, we need to see that 2y has ‘–‘ in front of it, so we need to remove it and also we should know dividing a positive term by negative term will always give us a negative term.
Recently Updated Pages
Master Class 9 General Knowledge: Engaging Questions & Answers for Success
Master Class 9 Maths: Engaging Questions & Answers for Success
Master Class 9 Science: Engaging Questions & Answers for Success
Master Class 9 English: Engaging Questions & Answers for Success
Master Class 9 Social Science: Engaging Questions & Answers for Success
Class 9 Question and Answer - Your Ultimate Solutions Guide
Trending doubts
What is the difference between Atleast and Atmost in class 9 maths CBSE
Define force and write its SI unit
Distinguish between Khadar and Bhangar class 9 social science CBSE
Describe any five main characteristics of alluvial class 9 social science CBSE
When and where does the monsoon arrive in India class 9 social science CBSE
Distinguish between the following Ferrous and nonferrous class 9 social science CBSE