


How do you graph $ 3y + x = 0 $ on a coordinate graph?
Answer
542.1k+ views
Hint: Coordinate graph is nothing but the graph consists of abscissa and ordinate, that is $ x\;{\text{and}}\;y $ axes, you can draw the given equation on a coordinate graph using the plotting points method in which you have to first find some points through which the graph of given equation will pass, and you can find them by putting values of one variable and getting the value for another one. Then after plotting the points, join all the points and extend them to get the required line.
Complete step-by-step answer:
In order to graph the given equation of a straight line, that is $ 3y + x = 0 $ , we will first find some points occurring on the graph of the given equation.
To find the points, we will put random values of one variable and get the value of another one from the given equation. And to do this, we will make a table:
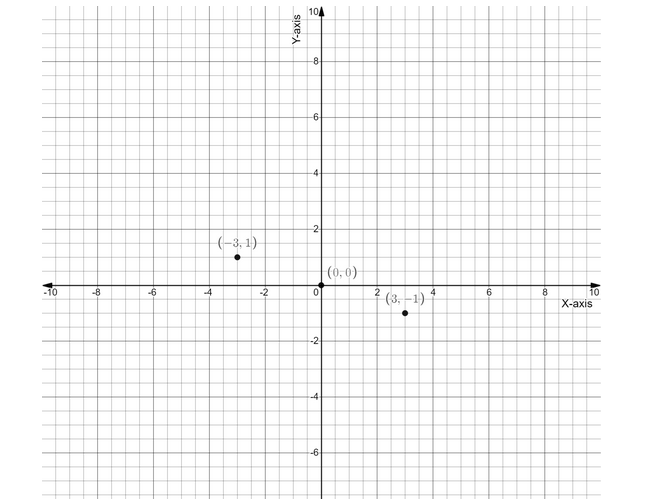
So we get some points, now plotting them on a graph paper or the coordinate graph, we will get
Now joining the points and also extending the line, we will get
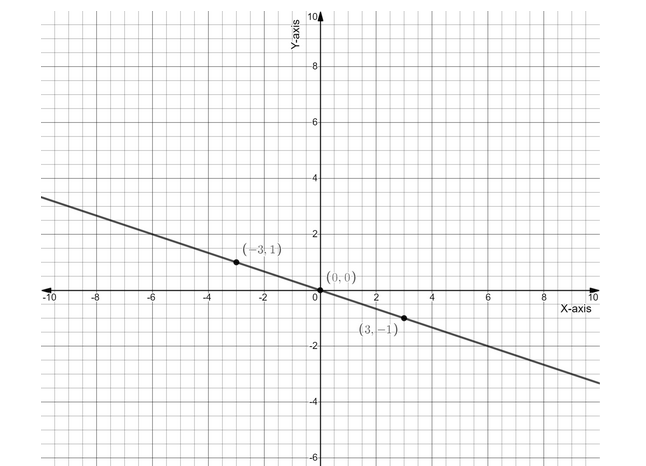
Therefore this is the required graph of the given equation.
Note: When taking the points then must take points which are at a reasonable distance from each other in order to avoid making the scale of the graph complex. Also try putting such values to get the points that you will get the whole number value of both for both variables for easiness in plotting the points.
Complete step-by-step answer:
In order to graph the given equation of a straight line, that is $ 3y + x = 0 $ , we will first find some points occurring on the graph of the given equation.
To find the points, we will put random values of one variable and get the value of another one from the given equation. And to do this, we will make a table:
| $ x $ | $ y = - \dfrac{x}{3} $ | Coordinate of the points $ (x,\;y) $ |
| $ 0 $ | $ 0 $ | $ (0,\;0) $ |
| $ 3 $ | $ - 1 $ | $ (3,\; - 1) $ |
| $ - 3 $ | $ 1 $ | $ ( - 3,\;1) $ |
So we get some points, now plotting them on a graph paper or the coordinate graph, we will get
Now joining the points and also extending the line, we will get
Therefore this is the required graph of the given equation.
Note: When taking the points then must take points which are at a reasonable distance from each other in order to avoid making the scale of the graph complex. Also try putting such values to get the points that you will get the whole number value of both for both variables for easiness in plotting the points.

Recently Updated Pages
Master Class 8 Social Science: Engaging Questions & Answers for Success
Master Class 8 English: Engaging Questions & Answers for Success
Class 8 Question and Answer - Your Ultimate Solutions Guide
Master Class 8 Maths: Engaging Questions & Answers for Success
Master Class 8 Science: Engaging Questions & Answers for Success
Master Class 7 English: Engaging Questions & Answers for Success
Trending doubts
What is BLO What is the full form of BLO class 8 social science CBSE
Citizens of India can vote at the age of A 18 years class 8 social science CBSE
Full form of STD, ISD and PCO
Advantages and disadvantages of science
Right to vote is a AFundamental Right BFundamental class 8 social science CBSE
What are the 12 elements of nature class 8 chemistry CBSE