


How do you graph $ 2x+y-4=0 $ by plotting points?
Answer
543.9k+ views
Hint: In the method of plotting points, we simply choose some values of x and find the value of the other variable y for these values of x. Then plot these points on the Cartesian plane to draw the graph. Choose any 2 values of x and find the values of y for those.
Complete step by step solution:
The easiest graph to plot is the graph of a line from the given equation of line.
The given equation is $ 2x+y-4=0 $ …. (i)
We can see that the given equation is the general form of the equation of a straight line.
I.e. $ ax+by+c=0 $ , where a, b and c are real numbers.
Therefore, we have confirmed that the given equation is an equation of a straight line. By geometry we know that we need just 2 points that lie on the line to plot the line.
Therefore, let us choose any 2 real values of x and substitute them in equation (i).
Let us choose the 2 values as $ x=0 $ and $ x=1 $ .
Now, substitute $ x=0 $ in equation (i).
$ \Rightarrow 2(0)+y-4=0 $
$ \Rightarrow y=4 $
Then, substitute $ x=1 $ in (i).
$ \Rightarrow 2(1)+y-4=0 $
$ \Rightarrow y=2 $
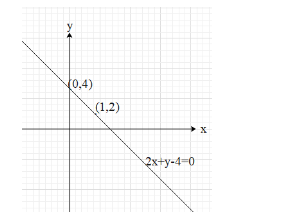
This means that the 2 points on the line are $ (0,4) $ and $ \left( 1,2 \right) $ .
Now, plot these two points on a Cartesian plane and draw the line that connects both the points.
Note: Note that the method of table of values works with an equation of a straight line only. Since a straight line has constant slope we can just find some points and draw the line. However, other functions with variable slope need much analysis then just some points. We have to check how the function behaves in some intervals. This can be done using continuity and differentiation.
Complete step by step solution:
The easiest graph to plot is the graph of a line from the given equation of line.
The given equation is $ 2x+y-4=0 $ …. (i)
We can see that the given equation is the general form of the equation of a straight line.
I.e. $ ax+by+c=0 $ , where a, b and c are real numbers.
Therefore, we have confirmed that the given equation is an equation of a straight line. By geometry we know that we need just 2 points that lie on the line to plot the line.
Therefore, let us choose any 2 real values of x and substitute them in equation (i).
Let us choose the 2 values as $ x=0 $ and $ x=1 $ .
Now, substitute $ x=0 $ in equation (i).
$ \Rightarrow 2(0)+y-4=0 $
$ \Rightarrow y=4 $
Then, substitute $ x=1 $ in (i).
$ \Rightarrow 2(1)+y-4=0 $
$ \Rightarrow y=2 $
This means that the 2 points on the line are $ (0,4) $ and $ \left( 1,2 \right) $ .
Now, plot these two points on a Cartesian plane and draw the line that connects both the points.
Note: Note that the method of table of values works with an equation of a straight line only. Since a straight line has constant slope we can just find some points and draw the line. However, other functions with variable slope need much analysis then just some points. We have to check how the function behaves in some intervals. This can be done using continuity and differentiation.

Recently Updated Pages
Master Class 8 Social Science: Engaging Questions & Answers for Success
Master Class 8 English: Engaging Questions & Answers for Success
Class 8 Question and Answer - Your Ultimate Solutions Guide
Master Class 8 Maths: Engaging Questions & Answers for Success
Master Class 8 Science: Engaging Questions & Answers for Success
Master Class 9 General Knowledge: Engaging Questions & Answers for Success
Trending doubts
What is BLO What is the full form of BLO class 8 social science CBSE
Citizens of India can vote at the age of A 18 years class 8 social science CBSE
Full form of STD, ISD and PCO
Advantages and disadvantages of science
Right to vote is a AFundamental Right BFundamental class 8 social science CBSE
What are the 12 elements of nature class 8 chemistry CBSE