


How do you graph \[-2x+3y=12\] on a coordinate graph?
Answer
555.6k+ views
Hint: Consider the given equation of the straight line and substitute the value of x equal to 0 and determine the value of y, assume the point as A (0, y). Now, in the next step substitute the value of y equal to 0 and determine the value of x, assume this point as B (x, 0). Join these points to form a straight line after plotting them on a graph paper.
Complete step by step answer:
Here, we have been provided with the equation \[-2x+3y=12\] and we are asked to draw its graph.
Now, we can clearly see that the equation \[-2x+3y=12\] is a linear equation in two variables, that means its graph will be a straight line. We know that to draw the graph of a straight line we need at least two points, so let us determine the points where this line will cut the x and y – axis.
For the equation \[-2x+3y=12\], we have,
(i) Substituting x = 0, we get,
\[\begin{align}
& \Rightarrow 0+3y=12 \\
& \Rightarrow 3y=12 \\
& \Rightarrow y=4 \\
\end{align}\]
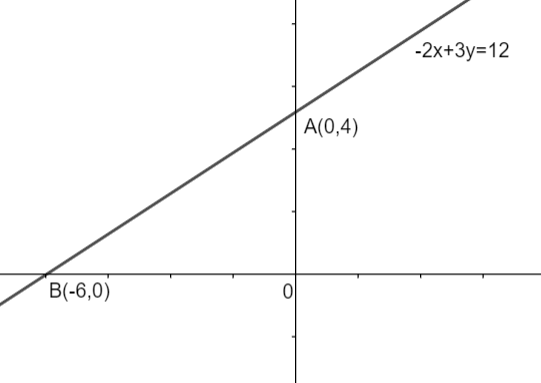
Therefore, the line will cut the y – axis at point A (0, 4).
(ii) Substituting y = 0, we get,
\[\begin{align}
& \Rightarrow -2x+0=12 \\
& \Rightarrow -2x=12 \\
& \Rightarrow x=-6 \\
\end{align}\]
Therefore, the line will cut the x – axis at point B (-6, 0).
So, plotting these two points on the graph paper and joining them with a ruler to form a straight line, it will look like: -
Note:
One may note that while drawing the graph, substitute x = 0 and y = 0 to determine the points. If we will use any other values of x and y then we will have to do some calculations to determine the points and to draw the graph. Do not forget to mark important points on the graph like the points where the line cuts the axes. Note that we cannot draw the graph using the coordinates of only one point, we need a minimum of two points.
Complete step by step answer:
Here, we have been provided with the equation \[-2x+3y=12\] and we are asked to draw its graph.
Now, we can clearly see that the equation \[-2x+3y=12\] is a linear equation in two variables, that means its graph will be a straight line. We know that to draw the graph of a straight line we need at least two points, so let us determine the points where this line will cut the x and y – axis.
For the equation \[-2x+3y=12\], we have,
(i) Substituting x = 0, we get,
\[\begin{align}
& \Rightarrow 0+3y=12 \\
& \Rightarrow 3y=12 \\
& \Rightarrow y=4 \\
\end{align}\]
Therefore, the line will cut the y – axis at point A (0, 4).
(ii) Substituting y = 0, we get,
\[\begin{align}
& \Rightarrow -2x+0=12 \\
& \Rightarrow -2x=12 \\
& \Rightarrow x=-6 \\
\end{align}\]
Therefore, the line will cut the x – axis at point B (-6, 0).
So, plotting these two points on the graph paper and joining them with a ruler to form a straight line, it will look like: -
Note:
One may note that while drawing the graph, substitute x = 0 and y = 0 to determine the points. If we will use any other values of x and y then we will have to do some calculations to determine the points and to draw the graph. Do not forget to mark important points on the graph like the points where the line cuts the axes. Note that we cannot draw the graph using the coordinates of only one point, we need a minimum of two points.
Recently Updated Pages
Master Class 11 Computer Science: Engaging Questions & Answers for Success
Master Class 11 Business Studies: Engaging Questions & Answers for Success
Master Class 11 Economics: Engaging Questions & Answers for Success
Master Class 11 English: Engaging Questions & Answers for Success
Master Class 11 Maths: Engaging Questions & Answers for Success
Master Class 11 Biology: Engaging Questions & Answers for Success
Trending doubts
One Metric ton is equal to kg A 10000 B 1000 C 100 class 11 physics CBSE
There are 720 permutations of the digits 1 2 3 4 5 class 11 maths CBSE
Discuss the various forms of bacteria class 11 biology CBSE
Draw a diagram of a plant cell and label at least eight class 11 biology CBSE
State the laws of reflection of light
Explain zero factorial class 11 maths CBSE