


How do you graph (1,3) on a coordinate graph?
Answer
590.4k+ views
Hint: Coordinates are always written in brackets and within the bracket two numbers are separated by a comma. Coordinates are ordered pairs of numbers; the point on the x-axis is denoted by the first number and the point on the y-axis is denoted by the second number.
Complete step-by-step answer:
x-coordinate is a number on the x-axis, the x-coordinate is also called abscissa and y-coordinate is a number on the y-axis and the y-coordinate is also called ordinate. For plotting points on a graph, we have to first identify the quadrant in which the given point lays or the axis on which the point lies.
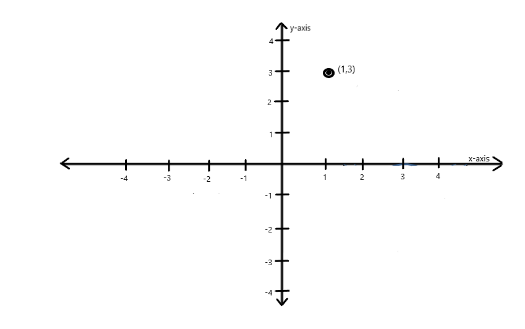
For the point (1,3) the x-coordinate is 1 and the y-coordinate is 3, both of the values are positive so this point lies in the first quadrant.
Below is the graph obtained on plotting this point in the coordinate graph –
Note: Two axes intersecting at right-angles form a graph; these two axes divide the graph into four quadrants. In the first quadrant, x-coordinates and y-coordinates are positive; in the second quadrant, x-coordinates are negative but y-coordinates are positive; in the third quadrant, both x and y-coordinates are negative and in the fourth quadrant, x-coordinates are positive but the y-coordinates are negative. In this question, the x and y-coordinate are positive so the point lies in the first quadrant. The origin is the point of intersection of the two axes.
Complete step-by-step answer:
x-coordinate is a number on the x-axis, the x-coordinate is also called abscissa and y-coordinate is a number on the y-axis and the y-coordinate is also called ordinate. For plotting points on a graph, we have to first identify the quadrant in which the given point lays or the axis on which the point lies.
For the point (1,3) the x-coordinate is 1 and the y-coordinate is 3, both of the values are positive so this point lies in the first quadrant.
Below is the graph obtained on plotting this point in the coordinate graph –
Note: Two axes intersecting at right-angles form a graph; these two axes divide the graph into four quadrants. In the first quadrant, x-coordinates and y-coordinates are positive; in the second quadrant, x-coordinates are negative but y-coordinates are positive; in the third quadrant, both x and y-coordinates are negative and in the fourth quadrant, x-coordinates are positive but the y-coordinates are negative. In this question, the x and y-coordinate are positive so the point lies in the first quadrant. The origin is the point of intersection of the two axes.

Recently Updated Pages
Master Class 11 Social Science: Engaging Questions & Answers for Success
Master Class 11 Chemistry: Engaging Questions & Answers for Success
Master Class 12 Business Studies: Engaging Questions & Answers for Success
Master Class 12 Chemistry: Engaging Questions & Answers for Success
Master Class 12 Biology: Engaging Questions & Answers for Success
Class 12 Question and Answer - Your Ultimate Solutions Guide
Trending doubts
What is BLO What is the full form of BLO class 8 social science CBSE
Citizens of India can vote at the age of A 18 years class 8 social science CBSE
Right to vote is a AFundamental Right BFundamental class 8 social science CBSE
Give me the opposite gender of Duck class 8 english CBSE
Full form of STD, ISD and PCO
Explain land use pattern in India and why has the land class 8 social science CBSE