


How do you graph $0.25x+3y>19$ on the coordinate plane?
Answer
537.3k+ views
Hint: To graph $0.25x+3y>19$ on the coordinate plane, this we have to find the boundary line for the inequality by replacing the greater than sign by an equal to sign.
Then we have to find the values of y for different values of x. We will then plot the graph accordingly and shade the portion above the border line.
Complete step-by-step answer:
We have to graph $0.25x+3y>19$ on the coordinate plane. For this we have to find the boundary line for the inequality. We can do this by considering the inequality as an equation by replacing the greater than sign by an equal to sign.
$\Rightarrow 0.25x+3y=19...\left( i \right)$
Now, we have to find the values of y for different values of x.
Let us consider $x=4$ . We have to value y when $x=4$ by substituting this value of x in equation (i).
$\Rightarrow \left( 0.25\times 4 \right)+3y=19$
Let us solve this equation.
$\begin{align}
& \Rightarrow 1+3y=19 \\
& \Rightarrow 3y=19-1 \\
& \Rightarrow 3y=18 \\
& \Rightarrow y=\dfrac{18}{3}=6 \\
\end{align}$
Similarly, let us find the value of y when $x=16$ .
$\Rightarrow \left( 0.25\times 16 \right)+3y=19$
Let us solve this equation.
$\begin{align}
& \Rightarrow 4+3y=19 \\
& \Rightarrow 3y=19-4 \\
& \Rightarrow 3y=15 \\
& \Rightarrow y=\dfrac{15}{3}=5 \\
\end{align}$
Now, let us consider $x=64$ .
$\begin{align}
& \Rightarrow \left( 0.25\times 64 \right)+3y=19 \\
& \Rightarrow 16+3y=19 \\
& \Rightarrow 3y=19-16 \\
& \Rightarrow 3y=3 \\
& \Rightarrow y=\dfrac{3}{3}=1 \\
\end{align}$
Let us tabulate these so that we can draw the graph easily.
Now, let us plot these points in the Cartesian plane.
We will show the boundary line as dotted as the given inequality does not contain an ‘equal’ to sign. The shaded portion represents the ‘>’ sign in the inequality. We shaded the upper portion because of the ‘>’ sign.
Note: Whenever we get an inequality to be shown graphically, then we should also replace the sign to an ‘=’ sign. When we get an equation with a ‘>’ sign, we will shade the top part or right side of the border line provide the border line will be dotted. When we get an equation with a ‘<’ sign, we will shade the bottom part or left side of the border line provide the border line will be dotted. When we get an ‘=’ sign along with any equality, we will draw the border line (it will not be dotted) along with the rule of > or < sign.
Then we have to find the values of y for different values of x. We will then plot the graph accordingly and shade the portion above the border line.
Complete step-by-step answer:
We have to graph $0.25x+3y>19$ on the coordinate plane. For this we have to find the boundary line for the inequality. We can do this by considering the inequality as an equation by replacing the greater than sign by an equal to sign.
$\Rightarrow 0.25x+3y=19...\left( i \right)$
Now, we have to find the values of y for different values of x.
Let us consider $x=4$ . We have to value y when $x=4$ by substituting this value of x in equation (i).
$\Rightarrow \left( 0.25\times 4 \right)+3y=19$
Let us solve this equation.
$\begin{align}
& \Rightarrow 1+3y=19 \\
& \Rightarrow 3y=19-1 \\
& \Rightarrow 3y=18 \\
& \Rightarrow y=\dfrac{18}{3}=6 \\
\end{align}$
Similarly, let us find the value of y when $x=16$ .
$\Rightarrow \left( 0.25\times 16 \right)+3y=19$
Let us solve this equation.
$\begin{align}
& \Rightarrow 4+3y=19 \\
& \Rightarrow 3y=19-4 \\
& \Rightarrow 3y=15 \\
& \Rightarrow y=\dfrac{15}{3}=5 \\
\end{align}$
Now, let us consider $x=64$ .
$\begin{align}
& \Rightarrow \left( 0.25\times 64 \right)+3y=19 \\
& \Rightarrow 16+3y=19 \\
& \Rightarrow 3y=19-16 \\
& \Rightarrow 3y=3 \\
& \Rightarrow y=\dfrac{3}{3}=1 \\
\end{align}$
Let us tabulate these so that we can draw the graph easily.
| x | y |
| 4 | 6 |
| 16 | 5 |
| 64 | 1 |
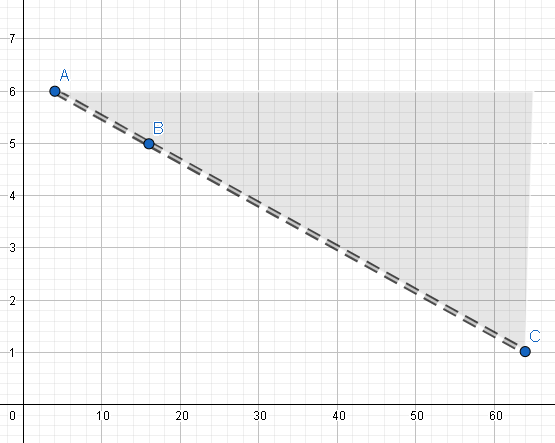
Now, let us plot these points in the Cartesian plane.
We will show the boundary line as dotted as the given inequality does not contain an ‘equal’ to sign. The shaded portion represents the ‘>’ sign in the inequality. We shaded the upper portion because of the ‘>’ sign.
Note: Whenever we get an inequality to be shown graphically, then we should also replace the sign to an ‘=’ sign. When we get an equation with a ‘>’ sign, we will shade the top part or right side of the border line provide the border line will be dotted. When we get an equation with a ‘<’ sign, we will shade the bottom part or left side of the border line provide the border line will be dotted. When we get an ‘=’ sign along with any equality, we will draw the border line (it will not be dotted) along with the rule of > or < sign.
Recently Updated Pages
Master Class 11 Computer Science: Engaging Questions & Answers for Success
Master Class 11 Business Studies: Engaging Questions & Answers for Success
Master Class 11 Economics: Engaging Questions & Answers for Success
Master Class 11 English: Engaging Questions & Answers for Success
Master Class 11 Maths: Engaging Questions & Answers for Success
Master Class 11 Biology: Engaging Questions & Answers for Success
Trending doubts
One Metric ton is equal to kg A 10000 B 1000 C 100 class 11 physics CBSE
There are 720 permutations of the digits 1 2 3 4 5 class 11 maths CBSE
Discuss the various forms of bacteria class 11 biology CBSE
Draw a diagram of a plant cell and label at least eight class 11 biology CBSE
State the laws of reflection of light
Explain zero factorial class 11 maths CBSE