


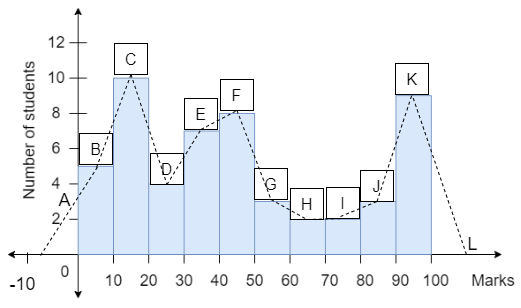
Given below is the graph of number of students to marks obtained by the students in continuous class intervals. Find the mean of the given data.
Answer
542.4k+ views
Hint: For solving this problem we convert the given graph into a table having two columns first one as marks interval and second as frequency that is number of students in that respective class interval and extend the table to some columns that contain number of students as \[{{f}_{i}}\], midpoint of marks given as \[{{x}_{i}}\], product of number of students and midpoint of marks as \[{{f}_{i}}{{x}_{i}}\], then we calculate the value of mean using the formula \[\bar{x}=\dfrac{\sum{{{f}_{i}}{{x}_{i}}}}{\sum{{{f}_{i}}}}\].
Complete step by step solution:
Let us assume that the given number of students in each interval is represented as \[{{f}_{i}}\].
Now let us create the table that contain number of students as \[{{f}_{i}}\], midpoint of marks given as \[{{x}_{i}}\], product of number of students and midpoint of marks as \[{{f}_{i}}{{x}_{i}}\].
Now, we know that the mean of the continuous data can be calculated by using the formula
\[\bar{x}=\dfrac{\sum{{{f}_{i}}{{x}_{i}}}}{\sum{{{f}_{i}}}}...........equation(i)\]
Let us find the unknown values.
\[\sum{{{f}_{i}}}\] is calculated by adding all the students, which in turn gives the total number of students.
From the table total number of students is calculated as
\[\begin{align}
& \Rightarrow \sum{{{f}_{i}}}=5+10+4+6+7+3+2+2+3+9 \\
& \Rightarrow \sum{{{f}_{i}}}=51 \\
\end{align}\]
Therefore, we can write \[\sum{{{f}_{i}}}=51\].
Now let us find the value of \[\sum{{{f}_{i}}{{x}_{i}}}\].
By adding all the values in the column \[{{f}_{i}}{{x}_{i}}\] we get
\[\begin{align}
& \Rightarrow \sum{{{f}_{i}}{{x}_{i}}}=25+150+100+210+315+165+130+150+255+855 \\
& \Rightarrow \sum{{{f}_{i}}{{x}_{i}}}=2355 \\
\end{align}\]
Now by substituting the values of \[\sum{{{f}_{i}}}\] and \[\sum{{{f}_{i}}{{x}_{i}}}\] in equation (i) we get
\[\begin{align}
& \Rightarrow \bar{x}=\dfrac{\sum{{{f}_{i}}{{x}_{i}}}}{\sum{{{f}_{i}}}} \\
& \Rightarrow \bar{x}=\dfrac{2355}{51} \\
& \Rightarrow \bar{x}=46.18 \\
\end{align}\]
Therefore the mean of given data is 46.18.
Note: Students may make mistakes in calculating the value of \[{{f}_{i}}{{x}_{i}}\]. As the data is written in one line type students may do multiplication mistake instead of multiplying the corresponding \[{{f}_{i}}\] and \[{{x}_{i}}\] values, in a hurry they multiply the value of \[{{x}_{i}}\] and different value of \[{{f}_{i}}\] which results in wrong answer. Calculation part only needs to be taken care of.
Complete step by step solution:
Let us assume that the given number of students in each interval is represented as \[{{f}_{i}}\].
Now let us create the table that contain number of students as \[{{f}_{i}}\], midpoint of marks given as \[{{x}_{i}}\], product of number of students and midpoint of marks as \[{{f}_{i}}{{x}_{i}}\].
| Marks | Number of students \[{{f}_{i}}\] | Midpoint of marks \[{{x}_{i}}\] | \[{{f}_{i}}{{x}_{i}}\] |
| 0-10 | 05 | 5 | 25 |
| 10-20 | 10 | 15 | 150 |
| 20-30 | 04 | 25 | 100 |
| 30-40 | 06 | 35 | 210 |
| 40-50 | 07 | 45 | 315 |
| 50-60 | 03 | 55 | 165 |
| 60-70 | 02 | 65 | 130 |
| 70-80 | 02 | 75 | 150 |
| 80-90 | 03 | 85 | 255 |
| 90-100 | 09 | 95 | 855 |
Now, we know that the mean of the continuous data can be calculated by using the formula
\[\bar{x}=\dfrac{\sum{{{f}_{i}}{{x}_{i}}}}{\sum{{{f}_{i}}}}...........equation(i)\]
Let us find the unknown values.
\[\sum{{{f}_{i}}}\] is calculated by adding all the students, which in turn gives the total number of students.
From the table total number of students is calculated as
\[\begin{align}
& \Rightarrow \sum{{{f}_{i}}}=5+10+4+6+7+3+2+2+3+9 \\
& \Rightarrow \sum{{{f}_{i}}}=51 \\
\end{align}\]
Therefore, we can write \[\sum{{{f}_{i}}}=51\].
Now let us find the value of \[\sum{{{f}_{i}}{{x}_{i}}}\].
By adding all the values in the column \[{{f}_{i}}{{x}_{i}}\] we get
\[\begin{align}
& \Rightarrow \sum{{{f}_{i}}{{x}_{i}}}=25+150+100+210+315+165+130+150+255+855 \\
& \Rightarrow \sum{{{f}_{i}}{{x}_{i}}}=2355 \\
\end{align}\]
Now by substituting the values of \[\sum{{{f}_{i}}}\] and \[\sum{{{f}_{i}}{{x}_{i}}}\] in equation (i) we get
\[\begin{align}
& \Rightarrow \bar{x}=\dfrac{\sum{{{f}_{i}}{{x}_{i}}}}{\sum{{{f}_{i}}}} \\
& \Rightarrow \bar{x}=\dfrac{2355}{51} \\
& \Rightarrow \bar{x}=46.18 \\
\end{align}\]
Therefore the mean of given data is 46.18.
Note: Students may make mistakes in calculating the value of \[{{f}_{i}}{{x}_{i}}\]. As the data is written in one line type students may do multiplication mistake instead of multiplying the corresponding \[{{f}_{i}}\] and \[{{x}_{i}}\] values, in a hurry they multiply the value of \[{{x}_{i}}\] and different value of \[{{f}_{i}}\] which results in wrong answer. Calculation part only needs to be taken care of.
Recently Updated Pages
Master Class 8 Social Science: Engaging Questions & Answers for Success
Master Class 8 English: Engaging Questions & Answers for Success
Class 8 Question and Answer - Your Ultimate Solutions Guide
Master Class 8 Maths: Engaging Questions & Answers for Success
Master Class 8 Science: Engaging Questions & Answers for Success
Master Class 7 English: Engaging Questions & Answers for Success
Trending doubts
Difference Between Plant Cell and Animal Cell
Fill the blanks with the suitable prepositions 1 The class 9 english CBSE
Who is eligible for RTE class 9 social science CBSE
Which places in India experience sunrise first and class 9 social science CBSE
What is pollution? How many types of pollution? Define it
Name 10 Living and Non living things class 9 biology CBSE