


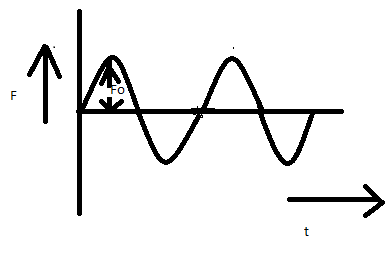
Force $F$ varies with times in accordance with the figure shown. The mean force will be:
A. ${F_ \circ }$
B. $\dfrac{{{F_ \circ }}}{2}$
C. $2{F_ \circ }$
D. Zero
Answer
588k+ views
Hint: Force is required to change the state of position of an object. The object may be at rest also.
Force is affected by mass and acceleration.
The slope is not important for a force-time graph, instead the area is important. Force multiplied by time, which is a quantity called impulse, is the area under the force-time graph.
Complete step by step answer:
In the figure we can see that force is along the x-axis and time is along the y-axis.
So, force varies with time.
Two maxima and two minima sinusoidal waves are shown. The amplitude or range of the wave is ${F_ \circ }$ .
We need to find the mean force for the graph.
The force applied by a body that travels for a definite period of time at a definite velocity is the average or mean force.
The average force is therefore equal to the body mass multiplied by the object’s average velocity over the specified time. The force will be defined as the frequency of momentum shift for a specific interval of time t. If the time interval is small, it is hard to determine the rate of change.
In the figure we observe that both the maxima and minima have the amplitude along force. Hence, the mean force is zero because the area above the x-axis under the curve is equal to the area below the x-axis under the curve.
So, the correct answer is “Option D”.
Note:
Since, the mean force in the graph is zero, the impulse will be zero, which also makes the momentum zero since the impulse is the rate of change in momentum. In the figure we observe that both the maxima and minima have the amplitude along force.
Recently Updated Pages
Master Class 11 Computer Science: Engaging Questions & Answers for Success
Master Class 11 Business Studies: Engaging Questions & Answers for Success
Master Class 11 Economics: Engaging Questions & Answers for Success
Master Class 11 English: Engaging Questions & Answers for Success
Master Class 11 Maths: Engaging Questions & Answers for Success
Master Class 11 Biology: Engaging Questions & Answers for Success
Trending doubts
One Metric ton is equal to kg A 10000 B 1000 C 100 class 11 physics CBSE
There are 720 permutations of the digits 1 2 3 4 5 class 11 maths CBSE
Discuss the various forms of bacteria class 11 biology CBSE
Draw a diagram of a plant cell and label at least eight class 11 biology CBSE
State the laws of reflection of light
Explain zero factorial class 11 maths CBSE