


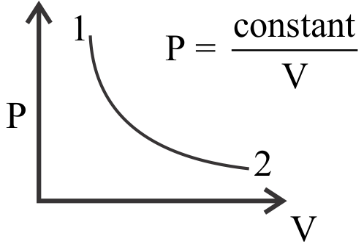
. For the $P - V$ diagram given for an ideal gas, out of the following which one correctly represents the $T - P$ diagram?
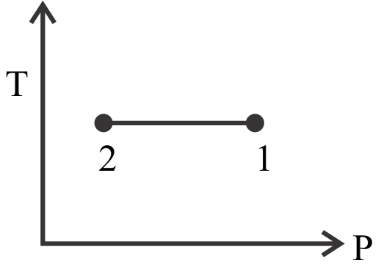
$\left( a \right)$
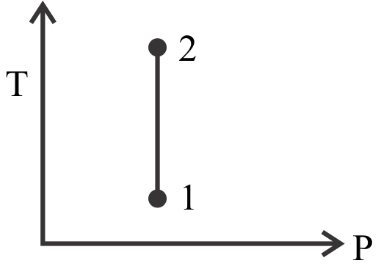
$\left( b \right)$
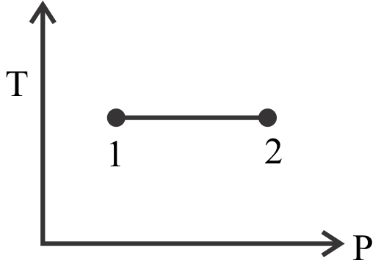
$\left( c \right)$
$\left( d \right)$
Answer
552.3k+ views
Hint We can easily solve this question by comparing the given equation with the ideal gas equation. On comparing we can determine the variance of $T$ for the given system. So for this we will use the ideal gas equation which is given by \[PV = nRT\] . And by using this relation we can solve this question.
Formula used:
$PV = nRT$
This is the ideal gas equation where $P$is the pressure, $V$is the volume, $T$is the temperature and $R$is the universal gas constant.
Complete step by step answer:
The given diagram applies for an ideal gas.
Now the ideal gas equation is given as \[PV = RT\]
$ \Rightarrow P = \dfrac{{RT}}{V}$
It’s given in the question that $P = \dfrac{{const.}}{V}$
Equating these two equations we can tell that in this particular system $T$ will be constant as $R$ is already a constant value named as the universal gas constant.
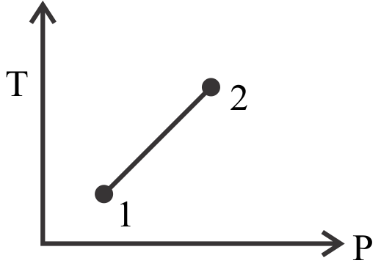
So, if we are to plot $T$ vs $P$ we can already tell if the value of $T$ will remain constant. Now we see that the value of $P$ drops from point $1$ to point $2$ .
In option $A$ we see that the value of $T$ remains fixed and the value of $P$ at point $2$ is less than its value at point $1$ which is essentially what the graph in the question shows us. So this can be a correct option.
Moving further, in option $B$ we see that value of $P$ remains constant whereas $T$ changes, which is not right as we know from the given question that $T$ remains constant. So it’s not the correct option.
In option $C$ we see that the value of $P$ at point $2$ is greater than its value at point $1$ . This is opposite to what is given in the question so this is also not the correct option.
Finally in option $D$ we see that the plotting for both the axes are wrong. The value of $T$ changes and the value of $P$ at point $2$ is greater than its value at point $1$ . So, this is also not the correct option.
Therefore the correct option is $A$ .
Note: We should know that according to Boyle's law, when $n$ and $T$ is constant then the volume will have an inverse relation with the pressure which is exerted by a gas. And mathematically it can be written as $v \prec \dfrac{1}{p}$ .
Formula used:
$PV = nRT$
This is the ideal gas equation where $P$is the pressure, $V$is the volume, $T$is the temperature and $R$is the universal gas constant.
Complete step by step answer:
The given diagram applies for an ideal gas.
Now the ideal gas equation is given as \[PV = RT\]
$ \Rightarrow P = \dfrac{{RT}}{V}$
It’s given in the question that $P = \dfrac{{const.}}{V}$
Equating these two equations we can tell that in this particular system $T$ will be constant as $R$ is already a constant value named as the universal gas constant.
So, if we are to plot $T$ vs $P$ we can already tell if the value of $T$ will remain constant. Now we see that the value of $P$ drops from point $1$ to point $2$ .
In option $A$ we see that the value of $T$ remains fixed and the value of $P$ at point $2$ is less than its value at point $1$ which is essentially what the graph in the question shows us. So this can be a correct option.
Moving further, in option $B$ we see that value of $P$ remains constant whereas $T$ changes, which is not right as we know from the given question that $T$ remains constant. So it’s not the correct option.
In option $C$ we see that the value of $P$ at point $2$ is greater than its value at point $1$ . This is opposite to what is given in the question so this is also not the correct option.
Finally in option $D$ we see that the plotting for both the axes are wrong. The value of $T$ changes and the value of $P$ at point $2$ is greater than its value at point $1$ . So, this is also not the correct option.
Therefore the correct option is $A$ .
Note: We should know that according to Boyle's law, when $n$ and $T$ is constant then the volume will have an inverse relation with the pressure which is exerted by a gas. And mathematically it can be written as $v \prec \dfrac{1}{p}$ .
Recently Updated Pages
Master Class 11 Computer Science: Engaging Questions & Answers for Success
Master Class 11 Business Studies: Engaging Questions & Answers for Success
Master Class 11 Economics: Engaging Questions & Answers for Success
Master Class 11 English: Engaging Questions & Answers for Success
Master Class 11 Maths: Engaging Questions & Answers for Success
Master Class 11 Biology: Engaging Questions & Answers for Success
Trending doubts
One Metric ton is equal to kg A 10000 B 1000 C 100 class 11 physics CBSE
There are 720 permutations of the digits 1 2 3 4 5 class 11 maths CBSE
Discuss the various forms of bacteria class 11 biology CBSE
Draw a diagram of a plant cell and label at least eight class 11 biology CBSE
State the laws of reflection of light
Explain zero factorial class 11 maths CBSE