


Following are the mark obtained by Sheetal in an examination
Subject Hindi English Maths Science Social studies Marks obtained 60 70 90 50 65
Draw pie chart
| Subject | Hindi | English | Maths | Science | Social studies |
| Marks obtained | 60 | 70 | 90 | 50 | 65 |
Answer
638.1k+ views
Hint: To draw a pie chart we need to find a central angle for each subject.And the central angle is given by $\dfrac{{marks{\text{ }}in{\text{ }}subject}}{{total{\text{ }}marks}}*360$ .Using this we need to find the central angle for each subject and then draw a circle of any radius and placing the protractor on the horizontal radius we need to mark the central angle and repeat the process for all the subjects
Complete step-by-step answer:
Here we are given the marks in every subject
To draw a pie chart we need to find a central angle for each subject
And the central angle is given by $\dfrac{{marks{\text{ }}in{\text{ }}subject}}{{total{\text{ }}marks}}*360$
So the total marks is given by the sum of all the marks
$ \Rightarrow 60 + 70 + 90 + 50 + 65 = 335$
So let's find the central angle for each subject
She has scored 60 in hindi
$
\Rightarrow \dfrac{{60}}{{335}}*360 \\
\Rightarrow \dfrac{{60}}{{67}}*72 \\
\Rightarrow \dfrac{{4320}}{{67}} = 64.5 \\
$
Hence the central angle for hindi is ${64.5^ \circ }$
She has scored 70 in english
$
\Rightarrow \dfrac{{70}}{{335}}*360 \\
\Rightarrow \dfrac{{25200}}{{335}} = 75.2 \\
$
Hence the central angle for english is ${75.2^ \circ }$
She has scored 90 in maths
$
\Rightarrow \dfrac{{90}}{{335}}*360 \\
\Rightarrow \dfrac{{32400}}{{335}} = 96.7 \\
$
Hence the central angle for maths is ${96.7^ \circ }$
She has scored 50 in science
$
\Rightarrow \dfrac{{50}}{{335}}*360 \\
\Rightarrow \dfrac{{18000}}{{335}} = 53.7 \\
$
Hence the central angle for science is ${53.7^ \circ }$
She has scored 65 in social studies
$
\Rightarrow \dfrac{{65}}{{335}}*360 \\
\Rightarrow \dfrac{{23400}}{{335}} = 69.9 \\
$
Hence the central angle for social studies is ${69.9^ \circ }$
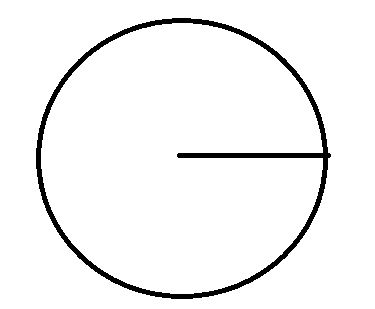
To draw a pie chart we need to draw a circle with any radius
Draw the horizontal radius
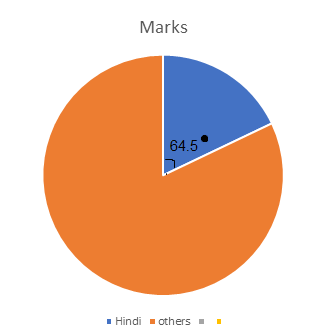
Now place the protractor on the radius and mark the angle for hindi
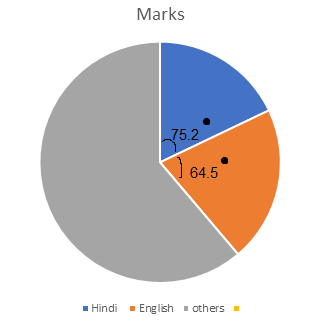
now place the protractor on the line drawn for hindi and mark the angle for English
And we need to repeat this procedure for all the subjects
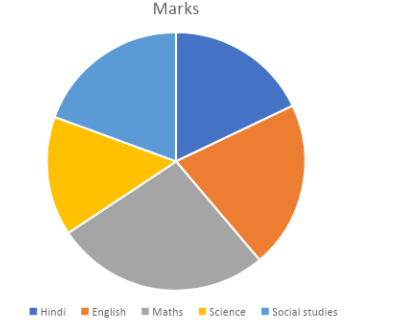
Hence the pie chart is obtained.
Note: Pie charts are generally used to show percentage or proportional data and usually the percentage represented by each category is provided next to the corresponding slice of pie. Pie charts are good for displaying data for around 6 categories or fewer.
If the data is given in percentage then the central angle is given by $\dfrac{{{\text{percentage value of the component}}}}{{100}}*360$
If the data describes the hours of the day then the central angle is given by $\dfrac{{{\text{hours in the component}}}}{{24}}*360$
Complete step-by-step answer:
Here we are given the marks in every subject
To draw a pie chart we need to find a central angle for each subject
And the central angle is given by $\dfrac{{marks{\text{ }}in{\text{ }}subject}}{{total{\text{ }}marks}}*360$
So the total marks is given by the sum of all the marks
$ \Rightarrow 60 + 70 + 90 + 50 + 65 = 335$
So let's find the central angle for each subject
She has scored 60 in hindi
$
\Rightarrow \dfrac{{60}}{{335}}*360 \\
\Rightarrow \dfrac{{60}}{{67}}*72 \\
\Rightarrow \dfrac{{4320}}{{67}} = 64.5 \\
$
Hence the central angle for hindi is ${64.5^ \circ }$
She has scored 70 in english
$
\Rightarrow \dfrac{{70}}{{335}}*360 \\
\Rightarrow \dfrac{{25200}}{{335}} = 75.2 \\
$
Hence the central angle for english is ${75.2^ \circ }$
She has scored 90 in maths
$
\Rightarrow \dfrac{{90}}{{335}}*360 \\
\Rightarrow \dfrac{{32400}}{{335}} = 96.7 \\
$
Hence the central angle for maths is ${96.7^ \circ }$
She has scored 50 in science
$
\Rightarrow \dfrac{{50}}{{335}}*360 \\
\Rightarrow \dfrac{{18000}}{{335}} = 53.7 \\
$
Hence the central angle for science is ${53.7^ \circ }$
She has scored 65 in social studies
$
\Rightarrow \dfrac{{65}}{{335}}*360 \\
\Rightarrow \dfrac{{23400}}{{335}} = 69.9 \\
$
Hence the central angle for social studies is ${69.9^ \circ }$
To draw a pie chart we need to draw a circle with any radius
Draw the horizontal radius
Now place the protractor on the radius and mark the angle for hindi
now place the protractor on the line drawn for hindi and mark the angle for English
And we need to repeat this procedure for all the subjects
Hence the pie chart is obtained.
Note: Pie charts are generally used to show percentage or proportional data and usually the percentage represented by each category is provided next to the corresponding slice of pie. Pie charts are good for displaying data for around 6 categories or fewer.
If the data is given in percentage then the central angle is given by $\dfrac{{{\text{percentage value of the component}}}}{{100}}*360$
If the data describes the hours of the day then the central angle is given by $\dfrac{{{\text{hours in the component}}}}{{24}}*360$
Recently Updated Pages
Basicity of sulphurous acid and sulphuric acid are
Master Class 12 Economics: Engaging Questions & Answers for Success
Master Class 12 Biology: Engaging Questions & Answers for Success
Master Class 11 English: Engaging Questions & Answers for Success
Master Class 11 Physics: Engaging Questions & Answers for Success
Master Class 11 Computer Science: Engaging Questions & Answers for Success
Trending doubts
What is the Total Duration of Football Match?
Explain the Treaty of Vienna of 1815 class 10 social science CBSE
In football, which nation is called "La Roja"?
Why is there a time difference of about 5 hours between class 10 social science CBSE
10 examples of evaporation in daily life with explanations
What is the full form of POSCO class 10 social science CBSE