


How do you find the x and y intercepts for $3y = 18$?
Answer
570k+ views
Hint: In this question, we need to find the x and y intercepts for the given equation. Note that the given equation is an equation of a straight line. Firstly, we find the $x$-intercept if it exists. Then we find the $y$-intercept. To find this we solve the equation for the variable y. Then from the obtained points we plot a graph of the given equation in the x-y plane.
Complete step by step answer:
Given an equation of the form $3y = 18$ …… (1)
We are asked to determine the x and y intercepts for the above equation given by the equation (1).
Note that the given equation is one of the equations of a straight line. We know this fact because the term y in the equation has a power 1 (so it is not squared or square rooted terms).
We can simplify the given equation, so that our calculation becomes easier.
We find the points of intercepts and then draw a line through them to understand the given problem properly.
Finding the $y$ -intercept :
To find this, we solve the given equation for the variable y.
We have from equation (1), $3y = 18$
Dividing the both sides of the equation by 3, we get,
$ \Rightarrow \dfrac{{3y}}{3} = \dfrac{{18}}{3}$
Cancelling the common terms and simplifying, we get,
$ \Rightarrow y = 6$
Hence the whole line $y = 6$ has a $y$-intercept of 6.
Finding the $x$ -intercept :
Note that there is no x term in the given equation. So we cannot set x equal to zero.
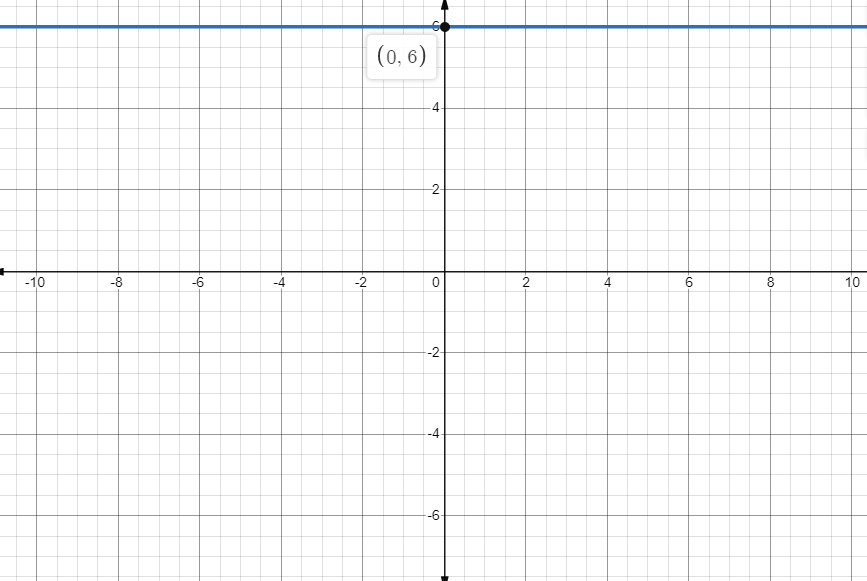
So the given equation does not have $x$-intercept. We plot the graph and we observe that the line is parallel to x-axis.
Hence the given equation $3y = 18$ has a $y$-intercept 6 and this line has no $x$-intercept.
Now we plot the graph to understand the given problem.
Note that the graph is a straight line and parallel to x-axis.
Note: Students must remember that to obtain the $x$-intercept, we set the value of y equal to zero and find the point. Then, to obtain the $y$-intercept, we set the value of x equal to zero and find the point. Then from obtained $(x,y)$ points we plot a graph of the given equation in the x-y plane.
Linear graphs have many applications. In our day-to-day life, we observe variation in the value of different quantities depending upon the variation in values of other quantities.
For example, if the number of persons visiting a cloth shop increases, then the earning of the shop also increases and vice versa.
Another example, if a number of people are employed, then the time taken to accomplish a job decreases.
We generally represent this with the help of linear graphs.
Complete step by step answer:
Given an equation of the form $3y = 18$ …… (1)
We are asked to determine the x and y intercepts for the above equation given by the equation (1).
Note that the given equation is one of the equations of a straight line. We know this fact because the term y in the equation has a power 1 (so it is not squared or square rooted terms).
We can simplify the given equation, so that our calculation becomes easier.
We find the points of intercepts and then draw a line through them to understand the given problem properly.
Finding the $y$ -intercept :
To find this, we solve the given equation for the variable y.
We have from equation (1), $3y = 18$
Dividing the both sides of the equation by 3, we get,
$ \Rightarrow \dfrac{{3y}}{3} = \dfrac{{18}}{3}$
Cancelling the common terms and simplifying, we get,
$ \Rightarrow y = 6$
Hence the whole line $y = 6$ has a $y$-intercept of 6.
Finding the $x$ -intercept :
Note that there is no x term in the given equation. So we cannot set x equal to zero.
So the given equation does not have $x$-intercept. We plot the graph and we observe that the line is parallel to x-axis.
Hence the given equation $3y = 18$ has a $y$-intercept 6 and this line has no $x$-intercept.
Now we plot the graph to understand the given problem.
Note that the graph is a straight line and parallel to x-axis.
Note: Students must remember that to obtain the $x$-intercept, we set the value of y equal to zero and find the point. Then, to obtain the $y$-intercept, we set the value of x equal to zero and find the point. Then from obtained $(x,y)$ points we plot a graph of the given equation in the x-y plane.
Linear graphs have many applications. In our day-to-day life, we observe variation in the value of different quantities depending upon the variation in values of other quantities.
For example, if the number of persons visiting a cloth shop increases, then the earning of the shop also increases and vice versa.
Another example, if a number of people are employed, then the time taken to accomplish a job decreases.
We generally represent this with the help of linear graphs.
Recently Updated Pages
Master Class 12 Business Studies: Engaging Questions & Answers for Success
Master Class 12 Biology: Engaging Questions & Answers for Success
Master Class 12 Chemistry: Engaging Questions & Answers for Success
Class 12 Question and Answer - Your Ultimate Solutions Guide
Master Class 11 Social Science: Engaging Questions & Answers for Success
Master Class 11 English: Engaging Questions & Answers for Success
Trending doubts
Which is more stable and why class 12 chemistry CBSE
What are the major means of transport Explain each class 12 social science CBSE
The value of constant k in coulombs law is beginalign class 12 physics CBSE
The first microscope was invented by A Leeuwenhoek class 12 biology CBSE
What is the Full Form of 1.DPT 2.DDT 3.BCG
What is the Full Form of PVC, PET, HDPE, LDPE, PP and PS ?