


Find the population of village S if the population of village X below the poverty line in 1997 is \[12160\].
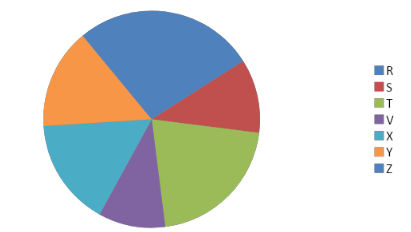
Proportion of population of sense villages in \[1997\] R, S, T, V, X, Y, Z is given in percentage.
R \[16%\] S \[11%\] T \[21%\] V \[10%\] X \[16%\] Y \[15%\] Z \[11%\]
| R | \[16%\] |
| S | \[11%\] |
| T | \[21%\] |
| V | \[10%\] |
| X | \[16%\] |
| Y | \[15%\] |
| Z | \[11%\] |
Answer
583.2k+ views
Hint: In this problem we will suppose that the population is $x$ then calculate the population of each section using the percentage of each section. Using ratio and proportion we will find the exact population of the village.
If suppose section A has y percent then its population $=\dfrac{A}{100}\times Total\text{ }Population$
Complete step-by-step answer:
Given, the population of village X below the poverty line is \[12160\]. …. (i)
Now, let the population of village X be \[x\]. ……. (ii)
Then, \[38\% \] of \[x\]\[ = 12160\] [from eq, (i) & (ii)]
Because, \[38\% \] is the population of village X below the poverty line.
\[ \Rightarrow \,38\% \,of\,x = 12160\,\]
\[ \Rightarrow \,\dfrac{{38}}{{100}} \times \,x = 12160\,\]
\[ \Rightarrow \,38 \times \,x = 12160 \times 100\,\]
\[ \Rightarrow \,\,x = \dfrac{{12160 \times 100}}{{38}}\]
\[ \Rightarrow \,\,x = 320 \times 100\]
\[ \Rightarrow \,\,x = 32000\]
Now, if she the total population of village S, then
Given, percentage population of village X\[ = 16\% \]
Percentage population of village S\[ = 11\% \]
Population of village X\[ = x = 32000\]
Population of village S\[ = s\]
By comparing quantities
Ratio of percentage population of both village X and S \[ = \]Ratio of population of village X and S.
\[16:11 = 32000:S\]
\[ \Rightarrow \dfrac{{16}}{{11}} = \dfrac{{32000}}{S}\]
\[ \Rightarrow \dfrac{{16 \times S}}{S} = 32000 \times 11\]
$\Rightarrow$\[S = \dfrac{{32000 \times 11}}{{16}}\]
$\Rightarrow$\[S = 2000 \times 11\]
$\Rightarrow$\[S = 22000\]
Hence, the population of village S is \[22000\].
Note: The above given diagram in the question represents a pie chart. A pie chart is a circular statistical graphic which is divided into many slices to represent the numerical proportions.
Recently Updated Pages
Master Class 8 Social Science: Engaging Questions & Answers for Success
Master Class 8 English: Engaging Questions & Answers for Success
Class 8 Question and Answer - Your Ultimate Solutions Guide
Master Class 8 Maths: Engaging Questions & Answers for Success
Master Class 8 Science: Engaging Questions & Answers for Success
Master Class 9 General Knowledge: Engaging Questions & Answers for Success
Trending doubts
What is BLO What is the full form of BLO class 8 social science CBSE
Citizens of India can vote at the age of A 18 years class 8 social science CBSE
Full form of STD, ISD and PCO
Advantages and disadvantages of science
Right to vote is a AFundamental Right BFundamental class 8 social science CBSE
What are the 12 elements of nature class 8 chemistry CBSE