


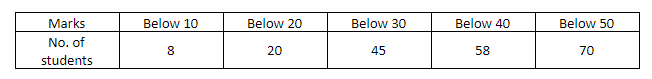
Find the mode of the following data:
Answer
644.7k+ views
Hint: Create a table with the columns of class intervals and frequency. Compute frequencies from the given cumulative frequencies. Take the interval with the highest frequency as modal class. Use the formula of mode for grouped data:
Mode$ = L + \dfrac{{({f_m} - {f_1})}}{{(2{f_m} - {f_1} - {f_2})}} \times h$
Where, L = lower limit of the modal class
fm = frequency of the modal class
h = width of modal class
f1 = frequency of the class preceding the modal class
f2 = frequency of the class succeeding the modal class
Substitute the values to obtain the required answer.
Complete step by step solution: We have with us a frequency distribution table.
Let us discuss mode.
Mode is the value with the highest frequency in a set of observations.
As we are given a frequency distribution table, we will use the formula of mode for grouped data.
Below are given the steps to be followed before using the formula:
1) Check if the frequency table consists of columns of class intervals and frequencies.
2) If not, create a new table wherein we will have two columns
3) In the first column, write down the class intervals
4) In the second column, write down the corresponding frequencies.
After creating
Mode$ = L + \dfrac{{({f_m} - {f_1})}}{{(2{f_m} - {f_1} - {f_2})}} \times h$
Where,
L = lower limit of the modal class
fm = frequency of the modal class
h = width of modal class
f1 = frequency of the class preceding the modal class
f2 = frequency of the class succeeding the modal class
In the given table, we have cumulative frequencies instead of frequency.
So, let’s compute the frequency of each class interval.
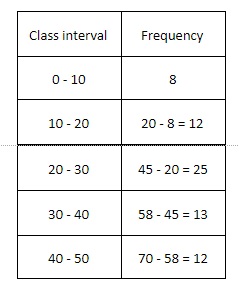
Here, the frequency is the highest for the class interval 20 - 30.
Therefore, the modal class is 20 - 30.
Also,
L = 20
fm = 25
h = 30 - 20 = 10
f1 = 12
f2 = 13.
Now that we have all the quantities mentioned in the formula for mode, we can substitute them accordingly.
Mode$ = 20 + \dfrac{{(25 - 12)}}{{(2(25) - 12 - 13)}} \times 10$
$ = 20 + \dfrac{{13}}{{25}} \times 10 \\
= 20 + 5.2 \\
= 25.2 \\ $
Hence the mode for the given data is 25.2.
Note: Some students tend to mistake cumulative frequency for frequency. One needs to know that if the data does not consist of class intervals like in this case, it is a must to create the class intervals and compute the corresponding frequencies.
Mode$ = L + \dfrac{{({f_m} - {f_1})}}{{(2{f_m} - {f_1} - {f_2})}} \times h$
Where, L = lower limit of the modal class
fm = frequency of the modal class
h = width of modal class
f1 = frequency of the class preceding the modal class
f2 = frequency of the class succeeding the modal class
Substitute the values to obtain the required answer.
Complete step by step solution: We have with us a frequency distribution table.
Let us discuss mode.
Mode is the value with the highest frequency in a set of observations.
As we are given a frequency distribution table, we will use the formula of mode for grouped data.
Below are given the steps to be followed before using the formula:
1) Check if the frequency table consists of columns of class intervals and frequencies.
2) If not, create a new table wherein we will have two columns
3) In the first column, write down the class intervals
4) In the second column, write down the corresponding frequencies.
After creating
Mode$ = L + \dfrac{{({f_m} - {f_1})}}{{(2{f_m} - {f_1} - {f_2})}} \times h$
Where,
L = lower limit of the modal class
fm = frequency of the modal class
h = width of modal class
f1 = frequency of the class preceding the modal class
f2 = frequency of the class succeeding the modal class
In the given table, we have cumulative frequencies instead of frequency.
So, let’s compute the frequency of each class interval.
Here, the frequency is the highest for the class interval 20 - 30.
Therefore, the modal class is 20 - 30.
Also,
L = 20
fm = 25
h = 30 - 20 = 10
f1 = 12
f2 = 13.
Now that we have all the quantities mentioned in the formula for mode, we can substitute them accordingly.
Mode$ = 20 + \dfrac{{(25 - 12)}}{{(2(25) - 12 - 13)}} \times 10$
$ = 20 + \dfrac{{13}}{{25}} \times 10 \\
= 20 + 5.2 \\
= 25.2 \\ $
Hence the mode for the given data is 25.2.
Note: Some students tend to mistake cumulative frequency for frequency. One needs to know that if the data does not consist of class intervals like in this case, it is a must to create the class intervals and compute the corresponding frequencies.
Recently Updated Pages
Basicity of sulphurous acid and sulphuric acid are
Master Class 10 Computer Science: Engaging Questions & Answers for Success
Master Class 10 Social Science: Engaging Questions & Answers for Success
Master Class 10 Science: Engaging Questions & Answers for Success
Class 10 Question and Answer - Your Ultimate Solutions Guide
Master Class 10 Maths: Engaging Questions & Answers for Success
Trending doubts
What is the Total Duration of Football Match?
Explain the Treaty of Vienna of 1815 class 10 social science CBSE
In football, which nation is called "La Roja"?
Why is there a time difference of about 5 hours between class 10 social science CBSE
10 examples of evaporation in daily life with explanations
What is the full form of POSCO class 10 social science CBSE