


Find the median weight of the students in the following data by ogive curves.
Weight (in kg) 40 – 45 45 – 50 50 – 55 55 – 60 60 – 65 65 – 70 70 – 75 No. of students 2 5 13 19 25 28 30
(a) 61.55
(b) 56.67
(c) 40.86
(d) None of the above
| Weight (in kg) | 40 – 45 | 45 – 50 | 50 – 55 | 55 – 60 | 60 – 65 | 65 – 70 | 70 – 75 |
| No. of students | 2 | 5 | 13 | 19 | 25 | 28 | 30 |
Answer
564.3k+ views
Hint: To solve this question, we will first define ogive and make less than a frequency table. Then by constructing the less than cumulative frequency table, we will draw the less than ogive of the given data. Finally, to calculate \[\dfrac{N}{2}\] where N is the frequency and then relocate \[\dfrac{N}{2}\] on the y axis to get the value on the x-axis.
Complete step-by-step answer:
Let us first define ogive and we are going to form ogive using the less than frequency table. The Ogive is defined as the frequency distribution graph of a series. The ogive is a graph of a cumulative distribution that explains the data values on the horizontal plane axis and all the cumulative relative frequencies, the cumulative relative frequencies or the cumulative percent frequencies on the vertical axis.
Let us find the table having the cumulative frequency of our given data in terms of “less than” data.
The steps to draw a less than ogive are as given below.
1. Draw and mark the horizontal and vertical axis.
2. Take the cumulative frequencies along the y-axis (vertical axis) and the upper-class limits on the x-axis (horizontal axis).
3. Against each upper-class limit, plot the cumulative frequencies.
4. Connect the points with the continuous curve.
We are given the table as
Then the less than table would be
Let us take the weight of the students on the x-axis and the number of students on the y-axis and draw ogive from the obtained “less than” table.
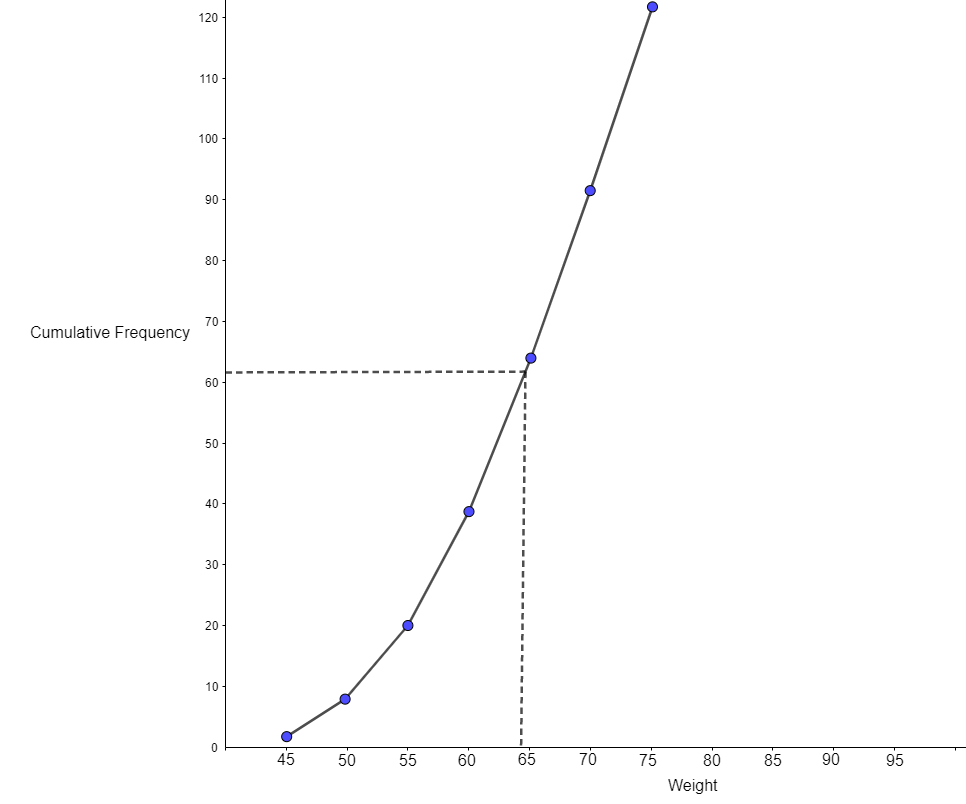
Let us determine the median from an ogive graph. If the total frequency, N = 30, then \[\dfrac{N}{2}=\dfrac{122}{2}=61.\] Let us draw the horizontal line from 61 at the y-axis then the point at which it touches the curve from there we are going to draw the vertical line to the x-axis. The location of the x – axis is 61.55. Hence, the median of the given data is given by 61.55.
So, the correct answer is “Option (a)”.
Note: The graphs of the frequency distribution are the frequency graphs that are used to exhibit the characteristics of discrete and continuous data. Such figures are more appealing to the eye than the tabular data. It helps to facilitate the comparative study of two or more frequency distributions. The two methods of Ogive are – less than ogive and greater than ogive. Here in this question, we have to solve using less than ogive and also greater than the ogive method is also possible.
Complete step-by-step answer:
Let us first define ogive and we are going to form ogive using the less than frequency table. The Ogive is defined as the frequency distribution graph of a series. The ogive is a graph of a cumulative distribution that explains the data values on the horizontal plane axis and all the cumulative relative frequencies, the cumulative relative frequencies or the cumulative percent frequencies on the vertical axis.
Let us find the table having the cumulative frequency of our given data in terms of “less than” data.
The steps to draw a less than ogive are as given below.
1. Draw and mark the horizontal and vertical axis.
2. Take the cumulative frequencies along the y-axis (vertical axis) and the upper-class limits on the x-axis (horizontal axis).
3. Against each upper-class limit, plot the cumulative frequencies.
4. Connect the points with the continuous curve.
We are given the table as
| Weight (in Kg) | Number of Students |
| 40 – 45 | 2 |
| 45 – 50 | 5 |
| 50 – 55 | 13 |
| 55 – 60 | 19 |
| 60 – 65 | 25 |
| 65 – 70 | 28 |
| 70 – 75 | 30 |
Then the less than table would be
| Weight | C.F |
| Less than 45 | 2 |
| Less than 50 | 7 |
| Less than 55 | 20 |
| Less than 60 | 39 |
| Less than 65 | 64 |
| Less than 70 | 92 |
| Less than 75 | 122 |
Let us take the weight of the students on the x-axis and the number of students on the y-axis and draw ogive from the obtained “less than” table.
Let us determine the median from an ogive graph. If the total frequency, N = 30, then \[\dfrac{N}{2}=\dfrac{122}{2}=61.\] Let us draw the horizontal line from 61 at the y-axis then the point at which it touches the curve from there we are going to draw the vertical line to the x-axis. The location of the x – axis is 61.55. Hence, the median of the given data is given by 61.55.
So, the correct answer is “Option (a)”.
Note: The graphs of the frequency distribution are the frequency graphs that are used to exhibit the characteristics of discrete and continuous data. Such figures are more appealing to the eye than the tabular data. It helps to facilitate the comparative study of two or more frequency distributions. The two methods of Ogive are – less than ogive and greater than ogive. Here in this question, we have to solve using less than ogive and also greater than the ogive method is also possible.
Recently Updated Pages
Master Class 10 Social Science: Engaging Questions & Answers for Success
Master Class 10 Science: Engaging Questions & Answers for Success
Master Class 10 Maths: Engaging Questions & Answers for Success
Master Class 10 General Knowledge: Engaging Questions & Answers for Success
Master Class 10 Computer Science: Engaging Questions & Answers for Success
Class 10 Question and Answer - Your Ultimate Solutions Guide
Trending doubts
What is the full form of PNG A Petrol Natural Gas B class 10 chemistry CBSE
Explain the Treaty of Vienna of 1815 class 10 social science CBSE
In cricket, how many legal balls are there in a standard over?
Why is there a time difference of about 5 hours between class 10 social science CBSE
Who Won 36 Oscar Awards? Record Holder Revealed
What is the median of the first 10 natural numbers class 10 maths CBSE