


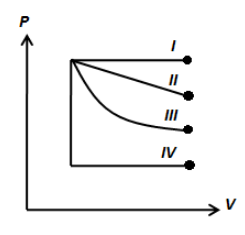
Figure shows four indicator diagrams. In which case is the work done maximum?
A. $IV$
B. $II$
C. $III$
D. $I$
Answer
594k+ views
Hint: In isothermal, reversible process, the temperature remains constant. In that case, the work done is given by the area under the curve in the PV diagram. The area under the curve is the maximum for the process which involves more pressure.
Complete answer:
In thermodynamics, when the state of the gas changes to A to B, the work done involve in this process is expressed as,
\[{W_{A \to B}} = \int\limits_{{V_A}}^{{V_B}} {PdV} \]
Here, P is the pressure of the gas and \[dV\] is the change in the volume of the gas.
We know that in an isothermal, reversible process, the temperature remains constant. In that case, the work done simply given by the area under the curve in the PV diagram.
If we look at the figure shown above, we can easily deduce that the area under the curve traced by I has more area than the rest of the curves. Therefore, the work done in the process followed by I is the maximum.
Thus, the correct answer is option D.
Additional information:
We can express the ideal gas equation as, \[PV = NkT\], where, N is the number of molecules and T is the temperature. From the above equation, we can write,
\[P = \dfrac{{NkT}}{V}\]
Therefore, work done by the gas is can be expressed as,
\[{W_{A \to B}} = \int\limits_{{V_A}}^{{V_B}} {\dfrac{{NkT}}{V}dV} \]
\[ \therefore {W_{A \to B}} = NkT\ln \dfrac{{{V_B}}}{{{V_A}}}\]
Note: The process followed by I and IV is the isobaric process where the pressure does not change. The process followed by II may be an isothermal process. However, the work done involved in each process is the area under the curve and the area under the curve is the maximum when the pressure is the maximum.
Recently Updated Pages
Master Class 11 Social Science: Engaging Questions & Answers for Success
Master Class 11 English: Engaging Questions & Answers for Success
Master Class 11 Maths: Engaging Questions & Answers for Success
Master Class 11 Chemistry: Engaging Questions & Answers for Success
Master Class 11 Biology: Engaging Questions & Answers for Success
Master Class 11 Physics: Engaging Questions & Answers for Success
Trending doubts
Differentiate between an exothermic and an endothermic class 11 chemistry CBSE
One Metric ton is equal to kg A 10000 B 1000 C 100 class 11 physics CBSE
Difference Between Prokaryotic Cells and Eukaryotic Cells
There are 720 permutations of the digits 1 2 3 4 5 class 11 maths CBSE
Draw a diagram of a plant cell and label at least eight class 11 biology CBSE
Which chemical is known as king of chemicals A H 2 class 11 chemistry CBSE