


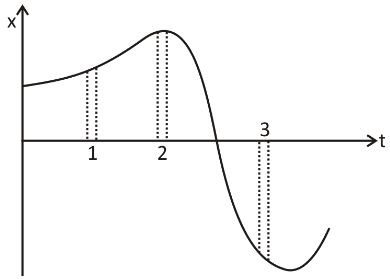
Figure gives the $x - t$ plot of a particle in one-dimensional motion. Three different equal intervals of time are shown. In which interval is the average speed greatest, and in which is it the least? Give the sign of average velocity for each interval.
Answer
608.1k+ views
Hint:First let us see what a speed-time graph is and what it signifies:
Speed-time graphs are very useful when explaining the motion of an object. The region below the speed-time graph reflects the distance travelled. This is the velocity time graph of an object travelling along a straight line to the north. The displacement of this object is the time graph velocity field. The speed-time graph of the particle provides details on the acceleration of the particle. The amplitude of the total acceleration of the particle depends on the slope of the graph at the same interval.
Complete answer:
From the figure it is evident that the greatest interval is $3$ and the smallest interval is $2$.The intervals $1$ and $2$ are positive whereas the interval $3$ is negative as it is a downward slope. The average speed of the particle shown in the $x - t$ graph is obtained over a given time interval from the slope of the graph.
It is evident from the graph that in intervals $3$ and $2$ respectively, the amplitude of the slope is maximum and minimum restive. The average speed of the particle is thus the highest at interval $3$ and the lowest at interval $2$.As the slope is positive in both intervals, the sign of average velocity is positive in both intervals $1$ and $2$. In Interval $3$, though, it is negative since the slope in this interval is negative.
Additional information:
Average speed depends on distance, and displacement affects average velocity. The average speed would be higher than the magnitude of the average velocity if an object changes direction during its journey.
Note:Constant velocity means that zero is the acceleration. For a given time interval, the difference in velocity equals the field over that interval under the acceleration graph. The speed-time graph of the particle provides details on the acceleration of the particle. The amplitude of the total acceleration of the particle depends on the slope of the graph at the same interval. So, to solve this question correctly we have to observe the slope of the graph.
Recently Updated Pages
Master Class 11 English: Engaging Questions & Answers for Success
Master Class 11 Social Science: Engaging Questions & Answers for Success
Master Class 11 Maths: Engaging Questions & Answers for Success
Master Class 11 Biology: Engaging Questions & Answers for Success
Master Class 11 Physics: Engaging Questions & Answers for Success
Master Class 11 Chemistry: Engaging Questions & Answers for Success
Trending doubts
One Metric ton is equal to kg A 10000 B 1000 C 100 class 11 physics CBSE
Difference Between Prokaryotic Cells and Eukaryotic Cells
Find the value of the expression given below sin 30circ class 11 maths CBSE
Difference between physical and chemical change class 11 chemistry CBSE
Two of the body parts which do not appear in MRI are class 11 biology CBSE
Draw a diagram of a plant cell and label at least eight class 11 biology CBSE