


How do you express the solution set of the inequality in interval notation and graph the interval of $x > \dfrac{7}{4}$?
Answer
553.8k+ views
Hint: In order to graph the above linear inequality having one variable $x\,$, to obtain the solution set note that the it is a strict inequality which will range from$\dfrac{7}{4}$ to infinity excluding the value $\dfrac{7}{4}$.Set will be $(\dfrac{7}{4},\infty )$. Now to graph in inequality , first convert it into equation by replacing the inequality symbol with the equal$ = $symbol and graph the equation by using the fact that that graph to the equation of form $x = a$ will always be a straight line parallel to y-axis and passing through the point $(a,0)$. The line drawn will be a dashed line as it is not the part of the solution. Shade the right side area of the line as \[0 > \dfrac{7}{4}\] is not true.
Complete step by step answer:
We are given a linear inequality in one variable, here we are having a variable $x$ telling $x > \dfrac{7}{4}$.Since we have given a strict inequality ($ > $). Solution will be from the value $\dfrac{7}{4}$to positive infinity excluding the value $\dfrac{7}{4}$.Therefore, the solution set of $x > \dfrac{7}{4}$ is $\left( {\dfrac{7}{4},\infty } \right)$.In order to graph an inequality, we actually first convert inequality into equation by replacing the inequality symbol with the equal $ = $ symbol and graph this equation. We get,
$x = \dfrac{7}{4}$
So to plot this linear equation we will recall one most important property of the plane which we have to remember: that graphs to any equation of the form $x = a$ will always be a straight line parallel to the y-axis and passing through the point $(a,0)$. The line drawn will be a dashed line, not a solid line. Solid line is only drawn if it is an equation or inequality of form ($ \geqslant , \leqslant $). This line indicates that it is not the part of the solution
remember one point that every inequality has a range of solutions.So, to calculate which side of line does our inequality cover putting $x = 0$.
$0 > \dfrac{7}{4}$
Since 0 is not smaller than $\dfrac{7}{4}$, so the inequality will contain the area which does not include the origin$(0,0)$i.e. the area right side of the line .So shade the area of right side of the line .Below is our final graph,
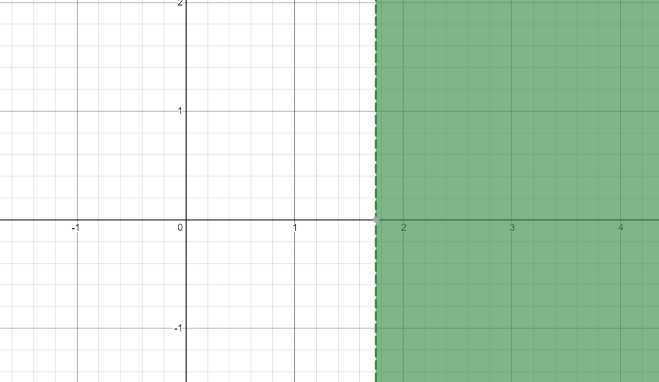
Hence, we’ve successfully plotted our graph of linear inequality $x > \dfrac{7}{4}$.
Additional Information:
Linear Inequality: A linear equality is a mathematical expression in which two values or two expressions are compared with each other. They are compared with the inequality symbols like $ < , > , \geqslant , \leqslant $.Values can be either numerical / algebraic or can be a combination of both . The inequality symbols ($ < , > $)are used to express strict inequalities and on the other hand symbols $( \geqslant , \leqslant )$are slack inequalities.
Note:1.A Cartesian Plane is given its name by the French mathematician Rene Descartes ,who first used this plane in the field of mathematics .It is defined as the two mutually perpendicular number line , the one which is horizontal is given name x-axis and the one which is vertical is known as y-axis. With the help of these axes we can plot any point on this cartesian plane with the help of an ordered pair of numbers.
2.Draw the cartesian plane only with the help of a straight ruler and pencil to get the perfect and accurate results.
3.You can take any two points from the equation to plot the graph to the equation.
Complete step by step answer:
We are given a linear inequality in one variable, here we are having a variable $x$ telling $x > \dfrac{7}{4}$.Since we have given a strict inequality ($ > $). Solution will be from the value $\dfrac{7}{4}$to positive infinity excluding the value $\dfrac{7}{4}$.Therefore, the solution set of $x > \dfrac{7}{4}$ is $\left( {\dfrac{7}{4},\infty } \right)$.In order to graph an inequality, we actually first convert inequality into equation by replacing the inequality symbol with the equal $ = $ symbol and graph this equation. We get,
$x = \dfrac{7}{4}$
So to plot this linear equation we will recall one most important property of the plane which we have to remember: that graphs to any equation of the form $x = a$ will always be a straight line parallel to the y-axis and passing through the point $(a,0)$. The line drawn will be a dashed line, not a solid line. Solid line is only drawn if it is an equation or inequality of form ($ \geqslant , \leqslant $). This line indicates that it is not the part of the solution
remember one point that every inequality has a range of solutions.So, to calculate which side of line does our inequality cover putting $x = 0$.
$0 > \dfrac{7}{4}$
Since 0 is not smaller than $\dfrac{7}{4}$, so the inequality will contain the area which does not include the origin$(0,0)$i.e. the area right side of the line .So shade the area of right side of the line .Below is our final graph,
Hence, we’ve successfully plotted our graph of linear inequality $x > \dfrac{7}{4}$.
Additional Information:
Linear Inequality: A linear equality is a mathematical expression in which two values or two expressions are compared with each other. They are compared with the inequality symbols like $ < , > , \geqslant , \leqslant $.Values can be either numerical / algebraic or can be a combination of both . The inequality symbols ($ < , > $)are used to express strict inequalities and on the other hand symbols $( \geqslant , \leqslant )$are slack inequalities.
Note:1.A Cartesian Plane is given its name by the French mathematician Rene Descartes ,who first used this plane in the field of mathematics .It is defined as the two mutually perpendicular number line , the one which is horizontal is given name x-axis and the one which is vertical is known as y-axis. With the help of these axes we can plot any point on this cartesian plane with the help of an ordered pair of numbers.
2.Draw the cartesian plane only with the help of a straight ruler and pencil to get the perfect and accurate results.
3.You can take any two points from the equation to plot the graph to the equation.

Recently Updated Pages
Master Class 9 General Knowledge: Engaging Questions & Answers for Success
Master Class 9 Social Science: Engaging Questions & Answers for Success
Master Class 9 English: Engaging Questions & Answers for Success
Master Class 9 Maths: Engaging Questions & Answers for Success
Master Class 9 Science: Engaging Questions & Answers for Success
Class 9 Question and Answer - Your Ultimate Solutions Guide
Trending doubts
Difference Between Plant Cell and Animal Cell
Fill the blanks with the suitable prepositions 1 The class 9 english CBSE
Who is eligible for RTE class 9 social science CBSE
Which places in India experience sunrise first and class 9 social science CBSE
What is pollution? How many types of pollution? Define it
Name 10 Living and Non living things class 9 biology CBSE