


Explain how one is able to construct a graph of the given equation:
$ - x + 2y = 1 $
Answer
531.6k+ views
Hint: Observe the given equation very carefully, and identify the variables given. When a linear equation is given, one of the methods of plotting the graph is using its slope and $ y $ - intercept method. Otherwise we can use tables to find out for which value of one variable, the other variable satisfies the equation. Plot the values in that table and join the points to give the graph of that linear equation.
Complete step-by-step answer:
Firstly we need to confirm what the linear equation given is;
Note that down:
$ - x + 2y = 1 $
Keeping only one variable on each side;
$ 2y = x + 1 $
Isolate the variable on the left hand side;
$ y = \dfrac{{x + 1}}{2} $
Now that we have the isolated variable $ y $ on the left hand side, we can give $ x $ several values and find the corresponding result for $ y $
Using the points for $ x $ and $ y $ , taking them as the coordinates, we can plot the graph.
Let us move us to make a table for $ x $ and $ y $ , where we give a value to $ x $ and find the value of $ y $ :
Since we have got a few values for variables $ x $ and $ y $ , we can go ahead and plot them;
We plot it in this manner;
- We first plot the value in the $ x $ column on the $ x $ - axis. Then we plot the corresponding $ y $ value from the next column onto the $ y $ - axis.
- Do the same for each of the following values and join the points, after that your plot of this linear equation should look like this;
Note: Another easy way of plotting a linear graph for any linear equation is by slope method. This we do so by first finding the intercepts for the variables, by finding the value of one variable by keeping the other as $ 0 $ . Then the coordinates will come as $ (0,y) $ and $ (x,0) $ , plot those points and when we join the line we get the graph for the linear equation.
Complete step-by-step answer:
Firstly we need to confirm what the linear equation given is;
Note that down:
$ - x + 2y = 1 $
Keeping only one variable on each side;
$ 2y = x + 1 $
Isolate the variable on the left hand side;
$ y = \dfrac{{x + 1}}{2} $
Now that we have the isolated variable $ y $ on the left hand side, we can give $ x $ several values and find the corresponding result for $ y $
Using the points for $ x $ and $ y $ , taking them as the coordinates, we can plot the graph.
Let us move us to make a table for $ x $ and $ y $ , where we give a value to $ x $ and find the value of $ y $ :
| $ x $ | $ y $ |
| $ 0 $ | $ 0.5 $ |
| $ - 1 $ | $ 0 $ |
| $ 3 $ | $ 2 $ |
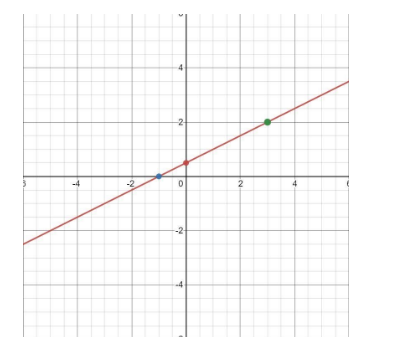
Since we have got a few values for variables $ x $ and $ y $ , we can go ahead and plot them;
We plot it in this manner;
- We first plot the value in the $ x $ column on the $ x $ - axis. Then we plot the corresponding $ y $ value from the next column onto the $ y $ - axis.
- Do the same for each of the following values and join the points, after that your plot of this linear equation should look like this;
Note: Another easy way of plotting a linear graph for any linear equation is by slope method. This we do so by first finding the intercepts for the variables, by finding the value of one variable by keeping the other as $ 0 $ . Then the coordinates will come as $ (0,y) $ and $ (x,0) $ , plot those points and when we join the line we get the graph for the linear equation.

Recently Updated Pages
Master Class 8 Social Science: Engaging Questions & Answers for Success
Master Class 8 English: Engaging Questions & Answers for Success
Class 8 Question and Answer - Your Ultimate Solutions Guide
Master Class 8 Maths: Engaging Questions & Answers for Success
Master Class 8 Science: Engaging Questions & Answers for Success
Master Class 9 General Knowledge: Engaging Questions & Answers for Success
Trending doubts
What is BLO What is the full form of BLO class 8 social science CBSE
Citizens of India can vote at the age of A 18 years class 8 social science CBSE
Full form of STD, ISD and PCO
Advantages and disadvantages of science
Right to vote is a AFundamental Right BFundamental class 8 social science CBSE
What are the 12 elements of nature class 8 chemistry CBSE