


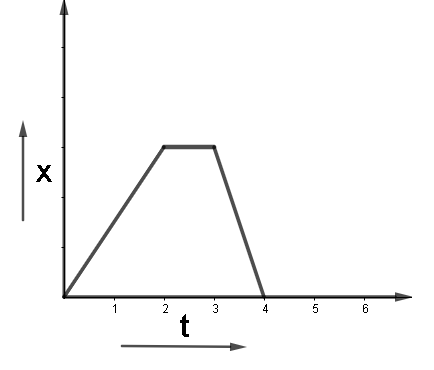
During which time interval are particles described by these position graphs at rest?
Answer
460.5k+ views
Hint: We know that a given particle is at rest when its speed is zero. Hence if we determine the time interval where the speed of the body is zero we will know the time interval where it is at rest. In the distance -time graph speed is given by its slope.
Complete answer:
A particle's speed is zero while it is at rest. And because speed is the slope of the x-t graph, it is evident that the graph becomes horizontal (slope =0) at the interval of \[2 - 3s.\]As a result, this interval is the solution.
Additional information:
The distance time graph places and discusses three linked components: time, distance, and speed. Here,
The bottom X-axis represents time.
The vertical Y-axis is used to represent distance.
The distance vs. time graph depicts many changes in an object's movement. The straight line on a graph, for example, indicates that an item moves at a constant pace(speed). If we see the above given graph constant speed is traveled in the time interval 0-2 seconds. Similarly there are a few more conclusions that can be drawn, they are :The speed is growing or accelerating when a curve is upward and when the curve is downward, however, it indicates that an object's motion is slowing down(decelerating).
Note:
Remember that only the slope of the distance-time graph gives speed. The slope being zero in velocity-time graphs or acceleration-time graphs doesn’t signify that the body is at rest.
Recently Updated Pages
Master Class 11 Computer Science: Engaging Questions & Answers for Success
Master Class 11 Business Studies: Engaging Questions & Answers for Success
Master Class 11 Economics: Engaging Questions & Answers for Success
Master Class 11 English: Engaging Questions & Answers for Success
Master Class 11 Maths: Engaging Questions & Answers for Success
Master Class 11 Biology: Engaging Questions & Answers for Success
Trending doubts
One Metric ton is equal to kg A 10000 B 1000 C 100 class 11 physics CBSE
There are 720 permutations of the digits 1 2 3 4 5 class 11 maths CBSE
Discuss the various forms of bacteria class 11 biology CBSE
Draw a diagram of a plant cell and label at least eight class 11 biology CBSE
State the laws of reflection of light
Explain zero factorial class 11 maths CBSE