


During the medical check-up of 35 students of a class, their weights were recorded as follows:
Weight (in kg) Number of students Less than 38 0 Less than 40 3 Less than 42 5 Less than 44 9 Less than 46 14 Less than 48 28 Less than 50 32 Less than 52 35
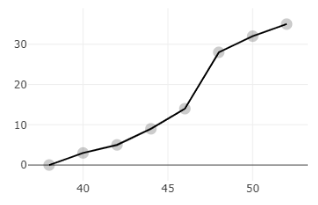
Draw a less than type ogive for the given data. Hence, obtain the median weight from the graph and verify the result by using formula.
| Weight (in kg) | Number of students |
| Less than 38 | 0 |
| Less than 40 | 3 |
| Less than 42 | 5 |
| Less than 44 | 9 |
| Less than 46 | 14 |
| Less than 48 | 28 |
| Less than 50 | 32 |
| Less than 52 | 35 |
Answer
606.3k+ views
Hint: To, draw an ogive of the given data set, we will have to find the cumulative frequency at each interval. After that, we can plot a graph of marks vs cumulative frequency. As it is mentioned to draw a “less than” ogive where the cumulative frequency increases with each class considered.
Then to find the median we will just take half of the total frequency and mark that point image in the graphs. After that find the median by the formula $l + \left( {\dfrac{{\dfrac{N}{2} - cf}}{f}} \right)h$.
Complete step-by-step answer:
Now, as we have the values of cumulative frequency at each interval, we can plot a graph between the upper limit of each interval and the cumulative frequency at that class. Remember, the reason why we are plotting the graph with the upper limit of the interval is that we are drawing a “less than” type ogive where the cumulative frequency at an interval is less than the upper limit of that interval.
Now, for the median, we will have to find $\dfrac{N}{2}$, where N is the total frequency which is equal to 35 here.
Now, we will draw a straight line from 17.5, and wherever it will meet on the x-axis, that will be our median.
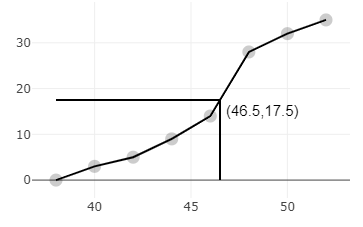
The median weight from the ogive is 46.5.
Now, find the frequency of each class interval,
Here the sum of the frequencies is $N = 35$.
Now the value of $\dfrac{N}{2}$ is,
$ \Rightarrow \dfrac{N}{2} = \dfrac{{35}}{2} = 17.5$
The value of $\dfrac{N}{2}$ lies in the interval 46 – 48.
So, the median class is 46 – 48.
The lower limit of the median class is,
$ \Rightarrow l = 46$
Cumulative frequency of class preceding the median class is,
$ \Rightarrow cf = 14$
The frequency of the median class is,
$ \Rightarrow f = 14$
The height of the class is,
$ \Rightarrow h = 46 - 44 = 2$
Then the value of the median is given by,
Median $ = l + \left[ {\dfrac{{\dfrac{N}{2} - cf}}{f}} \right]h$
Substitute the values,
$ \Rightarrow $ Median $ = 46 + \left[ {\dfrac{{17.5 - 14}}{{14}}} \right] \times 2$
Subtract the value in the numerator and multiply with 2,
$ \Rightarrow $ Median $ = 46 + \dfrac{7}{{14}}$
Divide numerator by the denominator,
$ \Rightarrow $ Median $ = 46 + 0.5$
Add the terms,
$\therefore $ Median $ = 46.5$
Hence it is verified.
Note: We should plot the upper-class limits, not the lower-class limits. If we plot lower class limits it would give the wrong ogive of the distribution. We should plot cumulative frequency not frequency. Do not plot cumulative frequency on X-axis and the upper limit on Y-axis.
Then to find the median we will just take half of the total frequency and mark that point image in the graphs. After that find the median by the formula $l + \left( {\dfrac{{\dfrac{N}{2} - cf}}{f}} \right)h$.
Complete step-by-step answer:
Now, as we have the values of cumulative frequency at each interval, we can plot a graph between the upper limit of each interval and the cumulative frequency at that class. Remember, the reason why we are plotting the graph with the upper limit of the interval is that we are drawing a “less than” type ogive where the cumulative frequency at an interval is less than the upper limit of that interval.
Now, for the median, we will have to find $\dfrac{N}{2}$, where N is the total frequency which is equal to 35 here.
Now, we will draw a straight line from 17.5, and wherever it will meet on the x-axis, that will be our median.
The median weight from the ogive is 46.5.
Now, find the frequency of each class interval,
| Class Interval | Cumulative Frequency | Frequency |
| 36 – 38 | 0 | 0 |
| 38 – 40 | 3 | 3 – 0 = 3 |
| 40 – 42 | 5 | 5 – 3 = 2 |
| 42 – 44 | 9 | 9 – 5 = 4 |
| 44 – 46 | 14 | 14 – 9 = 5 |
| 46 – 48 | 28 | 28 – 14 = 14 |
| 48 – 50 | 32 | 32 – 28 =4 |
| 50 – 52 | 35 | 35 – 32 = 3 |
Here the sum of the frequencies is $N = 35$.
Now the value of $\dfrac{N}{2}$ is,
$ \Rightarrow \dfrac{N}{2} = \dfrac{{35}}{2} = 17.5$
The value of $\dfrac{N}{2}$ lies in the interval 46 – 48.
So, the median class is 46 – 48.
The lower limit of the median class is,
$ \Rightarrow l = 46$
Cumulative frequency of class preceding the median class is,
$ \Rightarrow cf = 14$
The frequency of the median class is,
$ \Rightarrow f = 14$
The height of the class is,
$ \Rightarrow h = 46 - 44 = 2$
Then the value of the median is given by,
Median $ = l + \left[ {\dfrac{{\dfrac{N}{2} - cf}}{f}} \right]h$
Substitute the values,
$ \Rightarrow $ Median $ = 46 + \left[ {\dfrac{{17.5 - 14}}{{14}}} \right] \times 2$
Subtract the value in the numerator and multiply with 2,
$ \Rightarrow $ Median $ = 46 + \dfrac{7}{{14}}$
Divide numerator by the denominator,
$ \Rightarrow $ Median $ = 46 + 0.5$
Add the terms,
$\therefore $ Median $ = 46.5$
Hence it is verified.
Note: We should plot the upper-class limits, not the lower-class limits. If we plot lower class limits it would give the wrong ogive of the distribution. We should plot cumulative frequency not frequency. Do not plot cumulative frequency on X-axis and the upper limit on Y-axis.
Recently Updated Pages
Master Class 12 Economics: Engaging Questions & Answers for Success
Master Class 12 English: Engaging Questions & Answers for Success
Master Class 12 Social Science: Engaging Questions & Answers for Success
Master Class 12 Maths: Engaging Questions & Answers for Success
Master Class 12 Physics: Engaging Questions & Answers for Success
Master Class 11 Social Science: Engaging Questions & Answers for Success
Trending doubts
One Metric ton is equal to kg A 10000 B 1000 C 100 class 11 physics CBSE
Difference Between Prokaryotic Cells and Eukaryotic Cells
Find the value of the expression given below sin 30circ class 11 maths CBSE
Two of the body parts which do not appear in MRI are class 11 biology CBSE
Draw a diagram of nephron and explain its structur class 11 biology CBSE
10 examples of friction in our daily life