


Drawing straight parallel lines to axes:
Draw the graph of $ x = 3 $
Answer
585.9k+ views
Hint: We know that the graph of a straight line depends upon the variable present in the given equation. If there is only one variable x present in equation then its graph will be parallel to y –axis, if there is only one variable y present in equation then graph will be parallel to x-axis and if there are both variables present in equation then graph of the equation will be slant line. Hence, from this we can say that the graph of the given equation will be a line parallel to y-axis.
Complete step-by-step answer:
The equation of a straight line is $ x = 3 $ .
As there is no y variable in the given equation. Therefore, I can say that the graph of $ x = 3 $ will not meet anywhere in the y-axis.
And so the graph of will be a vertical line parallel to the y-axis.
To plot its graph we can consider different values of y but keeping the value of x always 3.
Taking points $ (3,0),\,\left( {3,3} \right)\,\,and\,\,(3, - 1) $ .
Now, using these point let's draw graph of $ x = 3 $
First draw $ x{x^`} $ axis and $ y{y^`} $ axis as shown below:
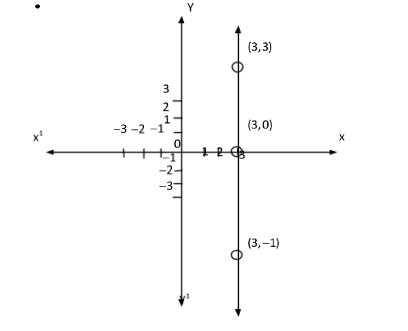
From the graph we came to know that $ x = 3 $ is a vertical line parallel to y-axis.
Hence, we conducted $ x = 3 $ graphically as a vertical line parallel to the y-axis.
Note: We know that a graph of a linear equation or a straight line is always a straight line. But there are three ways in which a graph of a line can be drawn. Graph of a line is either parallel to the x-axis, parallel to the y-axis or slant line. This we can easily judge from the given equation of line. If there is only one variable either x or y present in the equation, then the line will parallel to either x or y depending upon the given variable, otherwise the graph of line will be slant line.
Complete step-by-step answer:
The equation of a straight line is $ x = 3 $ .
As there is no y variable in the given equation. Therefore, I can say that the graph of $ x = 3 $ will not meet anywhere in the y-axis.
And so the graph of will be a vertical line parallel to the y-axis.
To plot its graph we can consider different values of y but keeping the value of x always 3.
Taking points $ (3,0),\,\left( {3,3} \right)\,\,and\,\,(3, - 1) $ .
Now, using these point let's draw graph of $ x = 3 $
First draw $ x{x^`} $ axis and $ y{y^`} $ axis as shown below:
From the graph we came to know that $ x = 3 $ is a vertical line parallel to y-axis.
Hence, we conducted $ x = 3 $ graphically as a vertical line parallel to the y-axis.
Note: We know that a graph of a linear equation or a straight line is always a straight line. But there are three ways in which a graph of a line can be drawn. Graph of a line is either parallel to the x-axis, parallel to the y-axis or slant line. This we can easily judge from the given equation of line. If there is only one variable either x or y present in the equation, then the line will parallel to either x or y depending upon the given variable, otherwise the graph of line will be slant line.
Recently Updated Pages
Basicity of sulphurous acid and sulphuric acid are
Master Class 11 Business Studies: Engaging Questions & Answers for Success
Master Class 11 Computer Science: Engaging Questions & Answers for Success
Master Class 11 Economics: Engaging Questions & Answers for Success
Master Class 12 English: Engaging Questions & Answers for Success
Master Class 12 Social Science: Engaging Questions & Answers for Success
Trending doubts
Fill the blanks with the suitable prepositions 1 The class 9 english CBSE
Difference Between Plant Cell and Animal Cell
What is the color of ferrous sulphate crystals? How does this color change after heating? Name the products formed on strongly heating ferrous sulphate crystals. What type of chemical reaction occurs in this type of change.
Find the greatest fivedigit number which is a perfect class 9 maths CBSE
Find the mode and median of the data 13 16 12 14 1-class-9-maths-CBSE
What is pollution? How many types of pollution? Define it
Fill the blanks with the suitable prepositions 1 The class 9 english CBSE
Difference Between Plant Cell and Animal Cell
What is the color of ferrous sulphate crystals? How does this color change after heating? Name the products formed on strongly heating ferrous sulphate crystals. What type of chemical reaction occurs in this type of change.