


Draw the shape of the velocity-times graph for a body moving with
(a) uniform velocity
(b) uniform acceleration.
Answer
512.4k+ views
Hint: A velocity-time graph can be used to determine whether or not an object is moving at any given point in time using a velocity-time graph. They can also be used to determine the speed at which an object is moving at any given time. We can calculate any acceleration, change in speed, and change in time using data from the graph.
Complete answer:
Graph of velocity vs. time. It's the graph made by charting the body's velocity along the Y-axis and time along the X-axis.
(a) For uniform velocity, a velocity-time graph is shown. The Velocity-Time graph is a straight line parallel to the time-axis for a body travelling at a constant velocity, as seen in fig (a)
The velocity time graph, with the Y-axis denoting velocity and the X-axis showing time, will look like this when the velocity is constant:
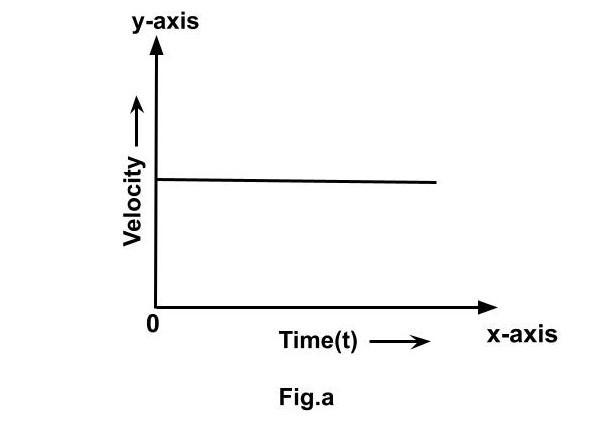
The velocity is constant (c) throughout the time interval, as seen in the graph. The velocity of all particles of matter will be constant at all times, regardless of how much time passes. In this situation, we've assumed a positive beginning velocity. If the initial velocity is negative, the graph will be different.
(b) A graph of uniform acceleration in terms of velocity and time. The increase in velocity for a body in uniform acceleration is proportional to the time taken. As seen in fig.(b), the velocity-time graph is a straight line inclined to the time-axis

Note:
It's worth mentioning that we say an object has uniform acceleration when its speed increases at a constant pace; the rate of acceleration is constant. A car's acceleration is not consistent if it accelerates up, then slows down, then speeds up again. The term "non-uniform" refers to the fact that the acceleration is not uniform. Uniform acceleration is defined as a change in velocity at the same rate over time. The change of non-equal velocity at equal intervals of time is known as non-uniform acceleration.
Complete answer:
Graph of velocity vs. time. It's the graph made by charting the body's velocity along the Y-axis and time along the X-axis.
(a) For uniform velocity, a velocity-time graph is shown. The Velocity-Time graph is a straight line parallel to the time-axis for a body travelling at a constant velocity, as seen in fig (a)
The velocity time graph, with the Y-axis denoting velocity and the X-axis showing time, will look like this when the velocity is constant:
The velocity is constant (c) throughout the time interval, as seen in the graph. The velocity of all particles of matter will be constant at all times, regardless of how much time passes. In this situation, we've assumed a positive beginning velocity. If the initial velocity is negative, the graph will be different.
(b) A graph of uniform acceleration in terms of velocity and time. The increase in velocity for a body in uniform acceleration is proportional to the time taken. As seen in fig.(b), the velocity-time graph is a straight line inclined to the time-axis
Note:
It's worth mentioning that we say an object has uniform acceleration when its speed increases at a constant pace; the rate of acceleration is constant. A car's acceleration is not consistent if it accelerates up, then slows down, then speeds up again. The term "non-uniform" refers to the fact that the acceleration is not uniform. Uniform acceleration is defined as a change in velocity at the same rate over time. The change of non-equal velocity at equal intervals of time is known as non-uniform acceleration.
Recently Updated Pages
Master Class 11 Social Science: Engaging Questions & Answers for Success
Master Class 11 Physics: Engaging Questions & Answers for Success
Master Class 11 Maths: Engaging Questions & Answers for Success
Master Class 11 Economics: Engaging Questions & Answers for Success
Master Class 11 Computer Science: Engaging Questions & Answers for Success
Master Class 11 Chemistry: Engaging Questions & Answers for Success
Trending doubts
One Metric ton is equal to kg A 10000 B 1000 C 100 class 11 physics CBSE
There are 720 permutations of the digits 1 2 3 4 5 class 11 maths CBSE
1 Quintal is equal to a 110 kg b 10 kg c 100kg d 1000 class 11 physics CBSE
State and prove Bernoullis theorem class 11 physics CBSE
Difference Between Prokaryotic Cells and Eukaryotic Cells
Which among the following are examples of coming together class 11 social science CBSE