


How do you draw the graph of $ y = {\left( {x - 2} \right)^2} - 3 $ by plotting the points ?
Answer
561.3k+ views
Hint: We are required to draw the graph of the function given to us, $ y = {\left( {x - 2} \right)^2} - 3 $ . Hence, we first have to find the nature of the curve that the given equation represents and then find the center or the vertex of the conic. Then, we draw the graph of the function keeping in mind the graphical transformations and the necessary graphing tools.
Complete step by step solution:
In this question, we are required to draw the graph of the function $ y = {\left( {x - 2} \right)^2} - 3 $ . This function has to be first converted into the standard form. Then, we find out the nature of the curve that the given equation represents.
So, $ y = {\left( {x - 2} \right)^2} - 3 $
Rearranging the terms, we get,
$ \Rightarrow \left( {y + 3} \right) = {\left( {x - 2} \right)^2} $
So, we can clearly see that the given equation represents a translated parabola of form $ \left( {y - \beta } \right) = {\left( {x - \alpha } \right)^2} $ where $ \left( {\alpha ,\beta } \right) $ is the vertex of the parabola. Hence, it is an upward facing parabola. Now, comparing $ \left( {y + 3} \right) = {\left( {x - 2} \right)^2} $ with general form of equation of parabola facing downwards, $ \left( {y - \beta } \right) = {\left( {x - \alpha } \right)^2} $ , where $ \left( {\alpha ,\beta } \right) $ is the vertex of the parabola, we get, $ \alpha = 2 $ and $ \beta = - 3 $ .
So, we get the coordinates of the vertex of the parabola as $ (2, - 3) $ .
Now, we put values of x as $ 0 $ and $ 1 $ .
Putting x as $ 0 $ , we get,
$ \Rightarrow \left( {y + 3} \right) = {\left( {0 - 2} \right)^2} $
$ \Rightarrow y = {\left( { - 2} \right)^2} - 3 $
$ \Rightarrow y = 4 - 3 = 1 $
Putting x as $ 1 $ , we get,
$ \Rightarrow \left( {y + 3} \right) = {\left( {1 - 2} \right)^2} $
$ \Rightarrow \left( {y + 3} \right) = {\left( { - 1} \right)^2} = 1 $
$ \Rightarrow y = - 2 $
Plotting the graph of the equation, we get,
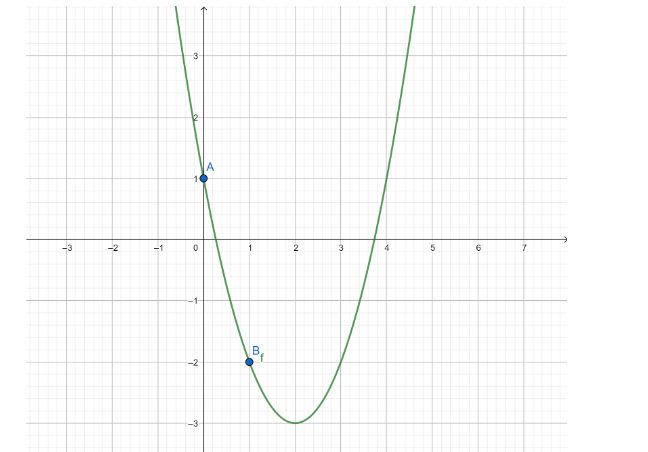
Note: To draw the graph of a function, we either need the points that lie on the graph of the function when plotted on graph paper or the equation of the function. In the given question, we are given an equation of parabola to plot on the graph that can be plotted easily once we get to know the vertex and focus of the parabola.
Complete step by step solution:
In this question, we are required to draw the graph of the function $ y = {\left( {x - 2} \right)^2} - 3 $ . This function has to be first converted into the standard form. Then, we find out the nature of the curve that the given equation represents.
So, $ y = {\left( {x - 2} \right)^2} - 3 $
Rearranging the terms, we get,
$ \Rightarrow \left( {y + 3} \right) = {\left( {x - 2} \right)^2} $
So, we can clearly see that the given equation represents a translated parabola of form $ \left( {y - \beta } \right) = {\left( {x - \alpha } \right)^2} $ where $ \left( {\alpha ,\beta } \right) $ is the vertex of the parabola. Hence, it is an upward facing parabola. Now, comparing $ \left( {y + 3} \right) = {\left( {x - 2} \right)^2} $ with general form of equation of parabola facing downwards, $ \left( {y - \beta } \right) = {\left( {x - \alpha } \right)^2} $ , where $ \left( {\alpha ,\beta } \right) $ is the vertex of the parabola, we get, $ \alpha = 2 $ and $ \beta = - 3 $ .
So, we get the coordinates of the vertex of the parabola as $ (2, - 3) $ .
Now, we put values of x as $ 0 $ and $ 1 $ .
Putting x as $ 0 $ , we get,
$ \Rightarrow \left( {y + 3} \right) = {\left( {0 - 2} \right)^2} $
$ \Rightarrow y = {\left( { - 2} \right)^2} - 3 $
$ \Rightarrow y = 4 - 3 = 1 $
Putting x as $ 1 $ , we get,
$ \Rightarrow \left( {y + 3} \right) = {\left( {1 - 2} \right)^2} $
$ \Rightarrow \left( {y + 3} \right) = {\left( { - 1} \right)^2} = 1 $
$ \Rightarrow y = - 2 $
Plotting the graph of the equation, we get,
Note: To draw the graph of a function, we either need the points that lie on the graph of the function when plotted on graph paper or the equation of the function. In the given question, we are given an equation of parabola to plot on the graph that can be plotted easily once we get to know the vertex and focus of the parabola.

Recently Updated Pages
Master Class 9 Social Science: Engaging Questions & Answers for Success
Master Class 9 Science: Engaging Questions & Answers for Success
Master Class 9 Maths: Engaging Questions & Answers for Success
Master Class 9 General Knowledge: Engaging Questions & Answers for Success
Class 9 Question and Answer - Your Ultimate Solutions Guide
Master Class 8 Social Science: Engaging Questions & Answers for Success
Trending doubts
Find the sum of series 1 + 2 + 3 + 4 + 5 + + 100 class 9 maths CBSE
What is the Full Form of ISI and RAW
Fill the blanks with the suitable prepositions 1 The class 9 english CBSE
Difference Between Plant Cell and Animal Cell
Who is eligible for RTE class 9 social science CBSE
What is pollution? How many types of pollution? Define it