


Draw the graph of \[y = 4x - 1\]
Answer
594.9k+ views
Hint: Here, we will first find the points of the graph by substituting some value of \[x\] in the given equation to find the corresponding value of \[y\]. We will then substitute some value of \[y\] to find the corresponding value of \[x\], this will give us another set of points. We will then draw the graph of the given equation by using these two points. We will mark these points on the graph and connect them by a straight line.
Complete step-by-step answer:
The given equation is \[y = 4x - 1\].
We observe from this equation that the powers of \[x\] and \[y\] are both one. So, the given equation is a linear equation.
The graph of a linear equation is always a straight line.
We will first find two points lying on the graph of the given linear equation. These two points should satisfy the given linear equation.
Let us rewrite the given equation as \[4x - y = 1\].
Now we will substitute \[x = 0\] in the given equation and find the value of \[y\]. Therefore, we get
\[\begin{array}{l}4\left( 0 \right) - y = 1\\ \Rightarrow - y = 1\\ \Rightarrow y = - 1\end{array}\]
We see that when \[x = 0\], we get \[y = - 1\]. So, one point is \[A(0, - 1)\].
To find another point, we will put \[y = 3\].
\[\begin{array}{l}4x - \left( 3 \right) = 1\\ \Rightarrow 4x = 1 + 3\end{array}\]
Adding the terms, we get
\[\begin{array}{l} \Rightarrow 4x = 4\\ \Rightarrow x = 1\end{array}\]
In this case, we get \[x = 1\].
So, the second point is \[B(1,3)\].
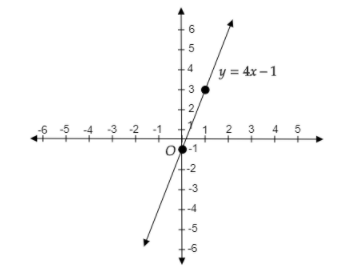
Using these points, we will draw the graph of \[4x - y = 1\].
The point \[A(0, - 1)\] will lie on the negative \[y\]-axis and the \[x - \] coordinate is zero. The point \[B(1,3)\] will lie in the first quadrant because both \[x\] and \[y\] coordinates are positive.
Therefore, we get the graph as follows:
Note: Another method to draw the graph is by slope-intercept form.
We shall compare the given linear equation to the slope-intercept form of a linear equation. The slope-intercept form \[y = mx + c\], where \[m\] is the slope of the line and \[c\] is the \[y - \] intercept, i.e., the point where the graph cuts the \[y - \] axis.
Comparing the equation \[y = 4x - 1\] with \[y = mx + c\], we get
\[m = 4\]
\[c = - 1\].
Here the slope is 4 and the \[y - \] intercept is \[ - 1\].
First, we have to mark the \[y - \] intercept.
Since, the \[y - \] intercept is negative, i.e., \[ - 1\], it will lie on the negative \[y\] axis.
Now, the slope is 4, which can be written as \[4 = \dfrac{4}{1}\].
Here the numerator 4 means we have to go 4 units up the point \[ - 1\] and the denominator 1 means we have to go right by 1 unit.
So, the point we reach is \[(1,3)\].
Complete step-by-step answer:
The given equation is \[y = 4x - 1\].
We observe from this equation that the powers of \[x\] and \[y\] are both one. So, the given equation is a linear equation.
The graph of a linear equation is always a straight line.
We will first find two points lying on the graph of the given linear equation. These two points should satisfy the given linear equation.
Let us rewrite the given equation as \[4x - y = 1\].
Now we will substitute \[x = 0\] in the given equation and find the value of \[y\]. Therefore, we get
\[\begin{array}{l}4\left( 0 \right) - y = 1\\ \Rightarrow - y = 1\\ \Rightarrow y = - 1\end{array}\]
We see that when \[x = 0\], we get \[y = - 1\]. So, one point is \[A(0, - 1)\].
To find another point, we will put \[y = 3\].
\[\begin{array}{l}4x - \left( 3 \right) = 1\\ \Rightarrow 4x = 1 + 3\end{array}\]
Adding the terms, we get
\[\begin{array}{l} \Rightarrow 4x = 4\\ \Rightarrow x = 1\end{array}\]
In this case, we get \[x = 1\].
So, the second point is \[B(1,3)\].
Using these points, we will draw the graph of \[4x - y = 1\].
The point \[A(0, - 1)\] will lie on the negative \[y\]-axis and the \[x - \] coordinate is zero. The point \[B(1,3)\] will lie in the first quadrant because both \[x\] and \[y\] coordinates are positive.
Therefore, we get the graph as follows:
Note: Another method to draw the graph is by slope-intercept form.
We shall compare the given linear equation to the slope-intercept form of a linear equation. The slope-intercept form \[y = mx + c\], where \[m\] is the slope of the line and \[c\] is the \[y - \] intercept, i.e., the point where the graph cuts the \[y - \] axis.
Comparing the equation \[y = 4x - 1\] with \[y = mx + c\], we get
\[m = 4\]
\[c = - 1\].
Here the slope is 4 and the \[y - \] intercept is \[ - 1\].
First, we have to mark the \[y - \] intercept.
Since, the \[y - \] intercept is negative, i.e., \[ - 1\], it will lie on the negative \[y\] axis.
Now, the slope is 4, which can be written as \[4 = \dfrac{4}{1}\].
Here the numerator 4 means we have to go 4 units up the point \[ - 1\] and the denominator 1 means we have to go right by 1 unit.
So, the point we reach is \[(1,3)\].
Recently Updated Pages
Master Class 11 English: Engaging Questions & Answers for Success
Master Class 11 Social Science: Engaging Questions & Answers for Success
Master Class 11 Maths: Engaging Questions & Answers for Success
Master Class 11 Biology: Engaging Questions & Answers for Success
Master Class 11 Physics: Engaging Questions & Answers for Success
Master Class 11 Chemistry: Engaging Questions & Answers for Success
Trending doubts
One Metric ton is equal to kg A 10000 B 1000 C 100 class 11 physics CBSE
Difference Between Prokaryotic Cells and Eukaryotic Cells
Find the value of the expression given below sin 30circ class 11 maths CBSE
1 ton equals to A 100 kg B 1000 kg C 10 kg D 10000 class 11 physics CBSE
Two of the body parts which do not appear in MRI are class 11 biology CBSE
What are hard magnetic materials class 11 physics CBSE