


How do you draw the graph of $ y = 1 + \sin x $ for $ 0 \leqslant x \leqslant 2\pi $ ?
Answer
541.8k+ views
Hint: A graph of a function f is the set of ordered pairs; the equation of graph is generally represented as $ y = f\left( x \right) $ , where x and $ f\left( x \right) $ are real numbers. We substitute the value of x and we determine the value of y and then we mark the points in the graph and we join the points.
Complete step-by-step answer:
Here, in the given question, we have to plot the graph for the given function. A graph of a function is a set of ordered pairs and it is represented as $ y = f\left( x \right) $ , where x and $ f\left( x \right) $ are real numbers. These pairs are in the form of cartesian form and the graph is the two-dimensional graph.
First, we have to find the value of y by using the graph equation $ y = 1 + \sin x $ and then limit the portion of the graph where x lies from $ 0 $ to $ 2\pi $ as we are given the condition $ 0 \leqslant x \leqslant 2\pi $ .
Let us substitute the value of x as $ \dfrac{\pi }{2} $ .
$ \Rightarrow y = 1 + \sin \left( {\dfrac{\pi }{2}} \right) $
Since we know that the value of $ \sin \dfrac{\pi }{2} $ is $ 1 $ .
$ \Rightarrow y = 1 + 1 $
$ \Rightarrow y = 2 $
Now, let us consider the value of x as $ 0 $ .
$ \Rightarrow y = 1 + \sin \left( 0 \right) $
Since we know that the value of $ \sin 0 $ is $ 0 $ .
$ \Rightarrow y = 1 $
Now we consider the value of x as $ \left( {\dfrac{\pi }{6}} \right) $ , the value of y is
$ \Rightarrow y = 1 + \sin \dfrac{\pi }{6} $
Since we know that the value of $ \sin \dfrac{\pi }{6} $ is $ \dfrac{1}{2} $ .
$ \Rightarrow y = \dfrac{3}{2} $
Now we draw a table for these values we have
We also know the nature of the graph of sine function. Hence, we can now plot the graph of the given function $ y = 1 + \sin x $ using graphical transformation. The graph plotted for these points is represented below:
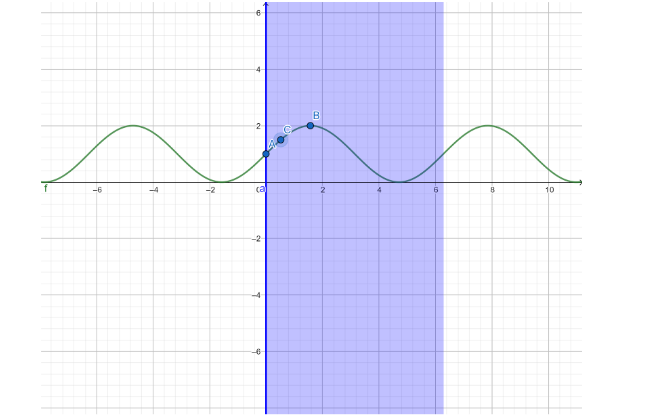
Note: The graph is plotted x-axis versus y axis. The graph is two dimensional. By the equation of a graph, we can plot the graph by assuming the value of x. We can’t assume the value of y. because the value of y depends on the value of x. Hence, we have plotted the graph of $ y = 1 + \sin x $ for $ 0 \leqslant x \leqslant 2\pi $
Complete step-by-step answer:
Here, in the given question, we have to plot the graph for the given function. A graph of a function is a set of ordered pairs and it is represented as $ y = f\left( x \right) $ , where x and $ f\left( x \right) $ are real numbers. These pairs are in the form of cartesian form and the graph is the two-dimensional graph.
First, we have to find the value of y by using the graph equation $ y = 1 + \sin x $ and then limit the portion of the graph where x lies from $ 0 $ to $ 2\pi $ as we are given the condition $ 0 \leqslant x \leqslant 2\pi $ .
Let us substitute the value of x as $ \dfrac{\pi }{2} $ .
$ \Rightarrow y = 1 + \sin \left( {\dfrac{\pi }{2}} \right) $
Since we know that the value of $ \sin \dfrac{\pi }{2} $ is $ 1 $ .
$ \Rightarrow y = 1 + 1 $
$ \Rightarrow y = 2 $
Now, let us consider the value of x as $ 0 $ .
$ \Rightarrow y = 1 + \sin \left( 0 \right) $
Since we know that the value of $ \sin 0 $ is $ 0 $ .
$ \Rightarrow y = 1 $
Now we consider the value of x as $ \left( {\dfrac{\pi }{6}} \right) $ , the value of y is
$ \Rightarrow y = 1 + \sin \dfrac{\pi }{6} $
Since we know that the value of $ \sin \dfrac{\pi }{6} $ is $ \dfrac{1}{2} $ .
$ \Rightarrow y = \dfrac{3}{2} $
Now we draw a table for these values we have
| x | $ \dfrac{\pi }{2} $ | $ \left( {\dfrac{\pi }{6}} \right) $ | $ 0 $ |
| y | $ 2 $ | $ \dfrac{3}{2} $ | $ 1 $ |
We also know the nature of the graph of sine function. Hence, we can now plot the graph of the given function $ y = 1 + \sin x $ using graphical transformation. The graph plotted for these points is represented below:
Note: The graph is plotted x-axis versus y axis. The graph is two dimensional. By the equation of a graph, we can plot the graph by assuming the value of x. We can’t assume the value of y. because the value of y depends on the value of x. Hence, we have plotted the graph of $ y = 1 + \sin x $ for $ 0 \leqslant x \leqslant 2\pi $
Recently Updated Pages
Master Class 11 Computer Science: Engaging Questions & Answers for Success
Master Class 11 Business Studies: Engaging Questions & Answers for Success
Master Class 11 Economics: Engaging Questions & Answers for Success
Master Class 11 English: Engaging Questions & Answers for Success
Master Class 11 Maths: Engaging Questions & Answers for Success
Master Class 11 Biology: Engaging Questions & Answers for Success
Trending doubts
One Metric ton is equal to kg A 10000 B 1000 C 100 class 11 physics CBSE
There are 720 permutations of the digits 1 2 3 4 5 class 11 maths CBSE
Discuss the various forms of bacteria class 11 biology CBSE
Draw a diagram of a plant cell and label at least eight class 11 biology CBSE
State the laws of reflection of light
Explain zero factorial class 11 maths CBSE