


How do you draw the graph of ${x^2} + {y^2} - 4x - 2y - 4 = 0$?
Answer
580.2k+ views
Hint:We are required to draw the graph of the function given to us, ${x^2} + {y^2} - 4x - 2y - 4 = 0$. Hence, we first have to find the nature of the curve that the given equation represents and then find the center or the vertex of the conic. Then, we draw the graph of the function keeping in mind the graphical transformations and the necessary graphing tools.
Complete step by step solution:
In this question, we are required to draw the graph of the function ${x^2} + {y^2} - 4x - 2y - 4 = 0$. This function has to be first converted into the standard form. Then, we find out the nature of the curve that the given equation represents.
So, ${x^2} + {y^2} - 4x - 2y - 4 = 0$
Rearranging the terms and grouping the terms with x and y, we get,
$ \Rightarrow \left( {{x^2} - 4x} \right) + \left( {{y^2} - 2y} \right) - 4 = 0$
Adding and subtracting same terms from the expression, we get,
$ \Rightarrow {x^2} - 4x + 4 + {y^2} - 2y + 1 - 4 - 4 - 1 = 0$
Now, forming whole square terms and simplifying calculations, we get,
$ \Rightarrow {\left( {x - 2} \right)^2} + {\left( {y - 1} \right)^2} - 9 = 0$
$ \Rightarrow {\left( {x - 2} \right)^2} + {\left( {y - 1} \right)^2} = {\left( 3 \right)^2}$
Now, we can conclude that the given equation is of a circle as it resembles the standard equation of a circle.
Now comparing with standard form of equation of circle ${(x - h)^2} + {(y - k)^2} = {r^2}$ where the center of the circle is $\left( {h,k} \right)$ and radius $ = r$.
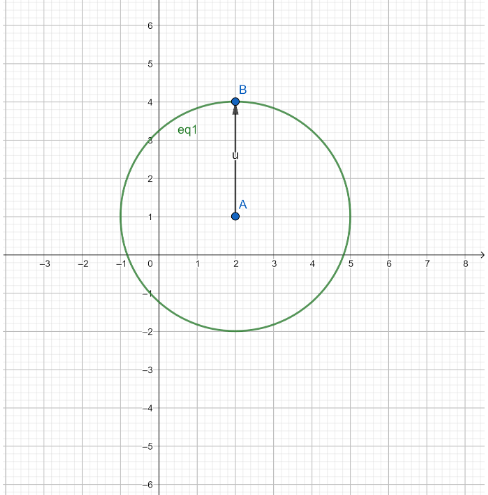
So, in the given equation, we get the coordinates of center $ = (2,1)$ and radius $ = 3$ units.
Plotting the graph of the equation, we get,
Note: To draw the graph of a function, we either need the points that lie on the graph of the function when plotted on graph paper or the equation of the function. In the given question, we are given an equation of circle to plot on the graph that can be plotted easily once we get to know the center of the circle and the radius.
Complete step by step solution:
In this question, we are required to draw the graph of the function ${x^2} + {y^2} - 4x - 2y - 4 = 0$. This function has to be first converted into the standard form. Then, we find out the nature of the curve that the given equation represents.
So, ${x^2} + {y^2} - 4x - 2y - 4 = 0$
Rearranging the terms and grouping the terms with x and y, we get,
$ \Rightarrow \left( {{x^2} - 4x} \right) + \left( {{y^2} - 2y} \right) - 4 = 0$
Adding and subtracting same terms from the expression, we get,
$ \Rightarrow {x^2} - 4x + 4 + {y^2} - 2y + 1 - 4 - 4 - 1 = 0$
Now, forming whole square terms and simplifying calculations, we get,
$ \Rightarrow {\left( {x - 2} \right)^2} + {\left( {y - 1} \right)^2} - 9 = 0$
$ \Rightarrow {\left( {x - 2} \right)^2} + {\left( {y - 1} \right)^2} = {\left( 3 \right)^2}$
Now, we can conclude that the given equation is of a circle as it resembles the standard equation of a circle.
Now comparing with standard form of equation of circle ${(x - h)^2} + {(y - k)^2} = {r^2}$ where the center of the circle is $\left( {h,k} \right)$ and radius $ = r$.
So, in the given equation, we get the coordinates of center $ = (2,1)$ and radius $ = 3$ units.
Plotting the graph of the equation, we get,
Note: To draw the graph of a function, we either need the points that lie on the graph of the function when plotted on graph paper or the equation of the function. In the given question, we are given an equation of circle to plot on the graph that can be plotted easily once we get to know the center of the circle and the radius.
Recently Updated Pages
Master Class 11 Social Science: Engaging Questions & Answers for Success
Master Class 11 English: Engaging Questions & Answers for Success
Master Class 11 Maths: Engaging Questions & Answers for Success
Master Class 11 Chemistry: Engaging Questions & Answers for Success
Master Class 11 Biology: Engaging Questions & Answers for Success
Master Class 11 Physics: Engaging Questions & Answers for Success
Trending doubts
One Metric ton is equal to kg A 10000 B 1000 C 100 class 11 physics CBSE
Difference Between Prokaryotic Cells and Eukaryotic Cells
Draw a diagram of a plant cell and label at least eight class 11 biology CBSE
Two of the body parts which do not appear in MRI are class 11 biology CBSE
Which gas is abundant in air class 11 chemistry CBSE
10 examples of friction in our daily life