


Draw the graph of \[x = 2\].
Answer
530.4k+ views
Hint: We need to draw a graph of a linear equation. A graph is drawn on the x-axis and y-axis. We will first assume the value of x and y. But, since the value of x is fixed i.e., 2, therefore, it means that both x and y are independent of each other and for any value of y the x remains the same.
Complete step-by-step solution:
Now, we know that the variables x and y are independent of each other. Therefore, let us try putting some value of y in the equation.
Let’s take y as 1 and substitute in the equation. Therefore,
\[y = 1\]
but the x remains the same as
\[x = 2\]
Since there is no variable of y in the equation, thus any change in y will not affect x.
Let’s look at the table below to get a better understanding.
Now, let’s try putting these values of x and y in the x-y plane.
Hence, the line will be parallel to the y-axis, and will never intersect it. It is a never-ending line and will not depend on the value of y.
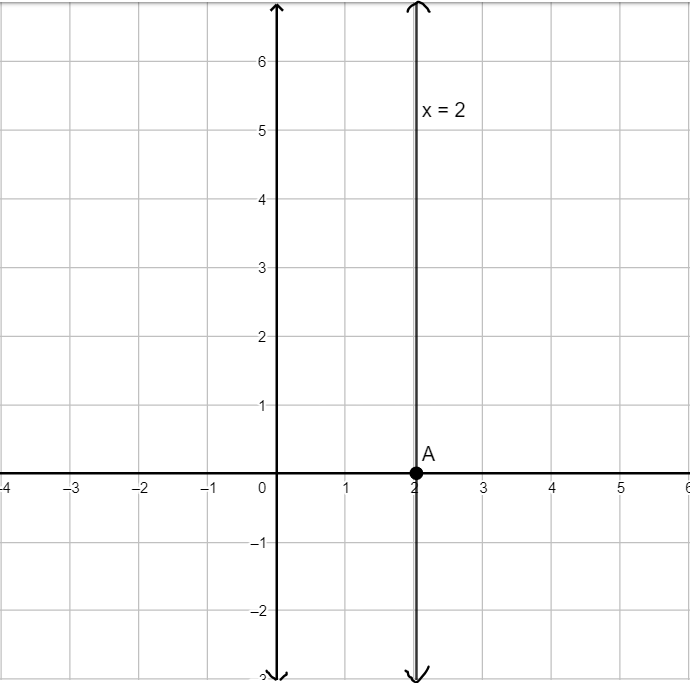
Note: We have simply shown a distinct line starting from the x-axis in the figure, but the line is never-ending in reality. If we are given the instruction to draw \[y = 2\] instead of \[x = 2\], we will draw a line parallel to the x-axis. To avoid making mistakes while drawing the line, you should create the graph on graph paper.
Complete step-by-step solution:
Now, we know that the variables x and y are independent of each other. Therefore, let us try putting some value of y in the equation.
Let’s take y as 1 and substitute in the equation. Therefore,
\[y = 1\]
but the x remains the same as
\[x = 2\]
Since there is no variable of y in the equation, thus any change in y will not affect x.
Let’s look at the table below to get a better understanding.
| x | 2 | 2 | 2 | 2 |
| y | 1 | 2 | 3 | ….. |
Now, let’s try putting these values of x and y in the x-y plane.
Hence, the line will be parallel to the y-axis, and will never intersect it. It is a never-ending line and will not depend on the value of y.
Note: We have simply shown a distinct line starting from the x-axis in the figure, but the line is never-ending in reality. If we are given the instruction to draw \[y = 2\] instead of \[x = 2\], we will draw a line parallel to the x-axis. To avoid making mistakes while drawing the line, you should create the graph on graph paper.
Recently Updated Pages
Master Class 12 Economics: Engaging Questions & Answers for Success
Master Class 12 English: Engaging Questions & Answers for Success
Master Class 12 Social Science: Engaging Questions & Answers for Success
Master Class 12 Maths: Engaging Questions & Answers for Success
Master Class 12 Physics: Engaging Questions & Answers for Success
Master Class 9 General Knowledge: Engaging Questions & Answers for Success
Trending doubts
Find the sum of series 1 + 2 + 3 + 4 + 5 + + 100 class 9 maths CBSE
Difference Between Plant Cell and Animal Cell
Fill the blanks with the suitable prepositions 1 The class 9 english CBSE
What is pollution? How many types of pollution? Define it
Name 10 Living and Non living things class 9 biology CBSE
What is the full form of pH?