


Draw the graph of \[x + 5 = 0\].
Answer
594.3k+ views
Hint: The given equation represents a straight line and is in the form of \[x = - k\], and by the equation we can say that it is parallel to \[y\]-axis when the given equation is represented in a Cartesian plane, and by the equation it is clear that it passes through the point \[\left( { - 5,0} \right)\], so the graph is straight line which is parallel to \[y\]-axis, and passes through the point \[\left( { - 5,0} \right)\], that will be represented in the graph.
Complete step-by-step answer:
Given equation is \[x + 5 = 0\],
This can be rewritten as, \[x = - 5\],
Now firstly we will find the equation of the line that is parallel to the \[y\]-axis,
We know that the general form of equation of line will be,
\[y = mx + c\],
And the slope of the line parallel to \[y\]-axis is equal to the slope of the \[y\]-axis which is equal to infinity, i.e.,\[\dfrac{1}{0} = \infty \],
Now substituting the slope value we get,
\[y = \dfrac{1}{0} \cdot x + c\],
Now taking c to other side we get,
\[y - c = \dfrac{1}{0} \cdot x\],
Now cross multiplying we get,
\[\left( 0 \right)y - c = x\]
So, the equation of the line parallel to \[y\]-axis will be \[x = 0\],
Now the general equation of line parallel to \[y\]-axis will become \[x = k\], where \[k\] is constant as 0 is also a constant.
So from the above derivation, the given equation \[x = - 5\] is a line parallel to y-axis, and also we know that the line passed through the point \[\left( { - 5,0} \right)\],
Now representing the above equation on then graph we get,
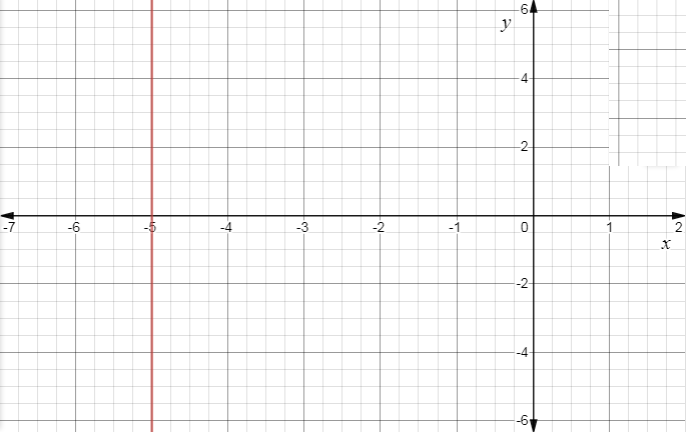
From the graph we can see that the line is parallel to \[y\]-axis and it passes through the point \[\left( { - 5,0} \right)\].
Note:
In these type of questions, that shows that line is parallel to \[x\]-axis and \[y\]-axis we must use slope intercept formula i.e., \[y = mx + c\], where m is the slope and c is the \[y\]-intercept of the line, and the graphs are usually represented on a Cartesian plane.
Complete step-by-step answer:
Given equation is \[x + 5 = 0\],
This can be rewritten as, \[x = - 5\],
Now firstly we will find the equation of the line that is parallel to the \[y\]-axis,
We know that the general form of equation of line will be,
\[y = mx + c\],
And the slope of the line parallel to \[y\]-axis is equal to the slope of the \[y\]-axis which is equal to infinity, i.e.,\[\dfrac{1}{0} = \infty \],
Now substituting the slope value we get,
\[y = \dfrac{1}{0} \cdot x + c\],
Now taking c to other side we get,
\[y - c = \dfrac{1}{0} \cdot x\],
Now cross multiplying we get,
\[\left( 0 \right)y - c = x\]
So, the equation of the line parallel to \[y\]-axis will be \[x = 0\],
Now the general equation of line parallel to \[y\]-axis will become \[x = k\], where \[k\] is constant as 0 is also a constant.
So from the above derivation, the given equation \[x = - 5\] is a line parallel to y-axis, and also we know that the line passed through the point \[\left( { - 5,0} \right)\],
Now representing the above equation on then graph we get,
From the graph we can see that the line is parallel to \[y\]-axis and it passes through the point \[\left( { - 5,0} \right)\].
Note:
In these type of questions, that shows that line is parallel to \[x\]-axis and \[y\]-axis we must use slope intercept formula i.e., \[y = mx + c\], where m is the slope and c is the \[y\]-intercept of the line, and the graphs are usually represented on a Cartesian plane.
Recently Updated Pages
Master Class 11 Social Science: Engaging Questions & Answers for Success
Master Class 11 Chemistry: Engaging Questions & Answers for Success
Master Class 9 General Knowledge: Engaging Questions & Answers for Success
Master Class 9 Maths: Engaging Questions & Answers for Success
Master Class 9 Science: Engaging Questions & Answers for Success
Master Class 9 English: Engaging Questions & Answers for Success
Trending doubts
One Metric ton is equal to kg A 10000 B 1000 C 100 class 11 physics CBSE
Difference Between Prokaryotic Cells and Eukaryotic Cells
Two of the body parts which do not appear in MRI are class 11 biology CBSE
Explain zero factorial class 11 maths CBSE
10 examples of friction in our daily life
Name the Largest and the Smallest Cell in the Human Body ?