


Draw the graph of the smallest integer function f(x) = [x]
Answer
660.6k+ views
Hint: Smallest integer function will give the same number if the number is an integer but it will give integer to the right of the number if the given number is in decimal form (no integer). Ex: [5.3] = 6, [6] = 6. Use this definition and define the smallest integer function mathematically from the domain of $0 < x \le 1,1 < x \le 2, 2 < x \le 3$ and so on. And represent the values of ‘y’ w.r.t ‘x’ on the coordinate axes to get the graph of this function.
Complete step-by-step answer:
Smallest integer function is a function which takes all the values $\left( -\infty ,\infty \right)$ and gives only integer part i.e. range of smallest integer function is Z (all integer).
So, let us find the smallest integer value of 5.3 i.e. we have to find the value of [5.3].
So, represent it on number line as

Now, we can observe that the integer just right to 5.3 is 6, it means smallest integer value of 5.3 is 6 i.e. [5.3] = 6
Example:
i) [0.5] = 1
ii) [2.3] = 3
iii) [-3.2] = -3
iv) [4] = 4
v) [-5] = -5
Smallest integer function will give the same number if the number is an integer but it will give integer to the right of the number if the number is of decimal form (not integer). Let us understand this definition with examples: Now, we can proceed, for drawing the graph of y = [x].
Let us define the smallest integer function for smaller ranges of domains.
So, we know, If
\[
0 < x \le 1\Rightarrow y=\left[ x \right]=1 \\
1 < x \le 2\Rightarrow y=\left[ x \right]=2 \\
2 < x \le 3\Rightarrow y=\left[ x \right]=3 \\
3 < x \le 4\Rightarrow y=\left[ x \right]=4 \\
\Rightarrow -1 < x \le 0 \Rightarrow y=\left[ x \right]=0 \\
-2 < x \le -1\Rightarrow y=\left[ x \right]=-1 \\
-3 < x \le -2\Rightarrow y=\left[ x \right]=-2 \\
-4 < x \le -3\Rightarrow y=\left[ x \right]=-3 \\
\]
Above results are given based on the definition of smallest integer function as it gives the right integer by the given number in domain on the number line (in case when number is not an integer) and if domain is an integer then we get the same integer in range as well. So, let us draw the graph with the help of the above results. So, we need to draw line y = 1 in domain of $x\in \left( 0,1 \right)$, y = 2 in domain of $x\in \left( 1,2 \right)$ and so on. We know that y = m line will be parallel to x-axis and give a constant value of ‘y’. so, we can draw graph of y = [x] as:
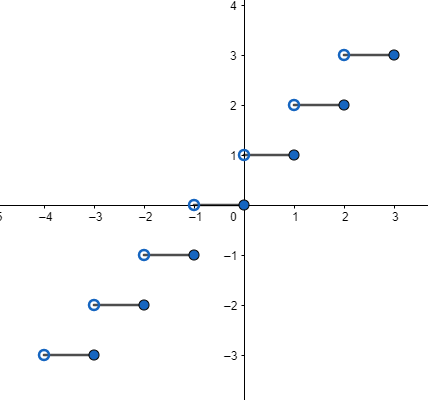
Where ‘0’ (white circle) means x = 0, x = 1, x = 2 and others will not lie on lines y = 1, y = 2, y = 3………. Respectively, ‘0’ (dark circle) means x = 0, x = 1, x = 2………… will lie on lines y = 0, y = 1, y = 2…….. respectively. It’s just a representation for excluding or including any value.
Note: One may take left side integers on the number line by putting the decimal numbers to the given smallest integer function, which is wrong. We take left side integers in case of greatest integer function.
Complete step-by-step answer:
Smallest integer function is a function which takes all the values $\left( -\infty ,\infty \right)$ and gives only integer part i.e. range of smallest integer function is Z (all integer).
So, let us find the smallest integer value of 5.3 i.e. we have to find the value of [5.3].
So, represent it on number line as
Now, we can observe that the integer just right to 5.3 is 6, it means smallest integer value of 5.3 is 6 i.e. [5.3] = 6
Example:
i) [0.5] = 1
ii) [2.3] = 3
iii) [-3.2] = -3
iv) [4] = 4
v) [-5] = -5
Smallest integer function will give the same number if the number is an integer but it will give integer to the right of the number if the number is of decimal form (not integer). Let us understand this definition with examples: Now, we can proceed, for drawing the graph of y = [x].
Let us define the smallest integer function for smaller ranges of domains.
So, we know, If
\[
0 < x \le 1\Rightarrow y=\left[ x \right]=1 \\
1 < x \le 2\Rightarrow y=\left[ x \right]=2 \\
2 < x \le 3\Rightarrow y=\left[ x \right]=3 \\
3 < x \le 4\Rightarrow y=\left[ x \right]=4 \\
\Rightarrow -1 < x \le 0 \Rightarrow y=\left[ x \right]=0 \\
-2 < x \le -1\Rightarrow y=\left[ x \right]=-1 \\
-3 < x \le -2\Rightarrow y=\left[ x \right]=-2 \\
-4 < x \le -3\Rightarrow y=\left[ x \right]=-3 \\
\]
Above results are given based on the definition of smallest integer function as it gives the right integer by the given number in domain on the number line (in case when number is not an integer) and if domain is an integer then we get the same integer in range as well. So, let us draw the graph with the help of the above results. So, we need to draw line y = 1 in domain of $x\in \left( 0,1 \right)$, y = 2 in domain of $x\in \left( 1,2 \right)$ and so on. We know that y = m line will be parallel to x-axis and give a constant value of ‘y’. so, we can draw graph of y = [x] as:
Where ‘0’ (white circle) means x = 0, x = 1, x = 2 and others will not lie on lines y = 1, y = 2, y = 3………. Respectively, ‘0’ (dark circle) means x = 0, x = 1, x = 2………… will lie on lines y = 0, y = 1, y = 2…….. respectively. It’s just a representation for excluding or including any value.
Note: One may take left side integers on the number line by putting the decimal numbers to the given smallest integer function, which is wrong. We take left side integers in case of greatest integer function.
Recently Updated Pages
Match columnI with columnII and choose the correct class 12 biology NEET_UG
Match columnI with columnII and choose the correct class 12 biology NEET_UG
Match columnI with columnII and choose the correct class 12 biology NEET_UG
Which plant will lose its economic value if its fruits class 12 biology NEET_UG
Human insulin is being commercially produced from a class 12 biology NEET_UG
Match columnI with columnII and choose the correct class 12 biology NEET_UG
Trending doubts
Which are the Top 10 Largest Countries of the World?
Draw a labelled sketch of the human eye class 12 physics CBSE
Differentiate between homogeneous and heterogeneous class 12 chemistry CBSE
Why is the cell called the structural and functional class 12 biology CBSE
Draw ray diagrams each showing i myopic eye and ii class 12 physics CBSE
Which is the correct genotypic ratio of mendel dihybrid class 12 biology CBSE