


Draw the graph of the polynomial \[f\left( x \right)={{x}^{3}}.\]
Answer
621.9k+ views
Hint: Assume f(x) = y and equate it with \[f\left( x \right)={{x}^{3}}.\] Now, substitute x = 0 to find the points at which the curve intersects the y-axis. Similarly, substitute y = 0 to find the points at which the curve intersects x – axis. Now, differentiate \[y={{x}^{3}}\] with respect to x and check if the function is increasing or decreasing. If \[\dfrac{dy}{dx}>0\] then it is increasing and if \[\dfrac{dy}{dx}<0\] then it is decreasing. Draw the curve with a free hand.
Complete step by step answer:
Here, we have been provided with the function \[f\left( x \right)={{x}^{3}}\] and we have been asked to draw its graph. Now, to draw the graph, we must know the points at which the curve intersects the coordinate axes if the function is increasing or decreasing. So, let us know these things about the given polynomial \[f\left( x \right)={{x}^{3}}.\] Here, we are assuming f(x) = y, so that the given polynomial becomes \[y={{x}^{3}}.\] To determine the point of intersection of the curves, we need to substitute x = 0 and y = 0 in the given equation one by one. So, we have,
(i) For x = 0, \[y={{0}^{3}}=0.\]
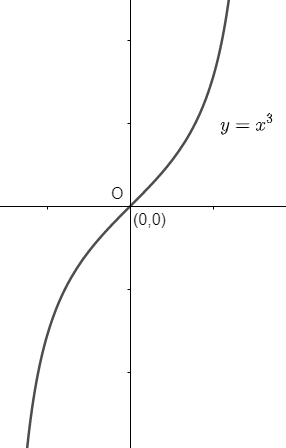
So, the curve intersects the y – axis at the origin (0, 0).
(ii) For y = 0, \[{{x}^{3}}=0,x=0.\]
So, the curve intersects the x – axis at the origin (0, 0).
Therefore, we can say that the curve \[y={{x}^{3}}\] intersects the axes at the origin only.
Now, differentiating \[y={{x}^{3}}\] with respect to x, we get,
\[\Rightarrow \dfrac{dy}{dx}=3{{x}^{2}}\]
Clearly, we can see that \[3{{x}^{2}}\] will be positive for all real values of x. So, we have,
\[\Rightarrow 3{{x}^{2}}>0\]
\[\Rightarrow \dfrac{dy}{dx}>0\]
Hence, the slope of the curve at any point will be positive.
Now, we can see that the range of the function \[f\left( x \right)={{x}^{3}}\] can be \[\left[ -\infty ,\infty \right].\] If we will substitute \[x=-\infty \] then \[f\left( x \right)=-\infty \] and if we substitute \[x=\infty \] then \[f\left( x \right)=\infty .\] So, the curve can be drawn as
Note: One may note that we cannot find the values of maxima and minima of the given equation with the help of the second derivative test because the function is extending from \[-\infty \] to \[\infty .\] Always remember the basic rules to draw a graph of a given function. First determine the points of intersection, the sign of \[\dfrac{dy}{dx}\] and then determine the maxima and minima if possible.
Complete step by step answer:
Here, we have been provided with the function \[f\left( x \right)={{x}^{3}}\] and we have been asked to draw its graph. Now, to draw the graph, we must know the points at which the curve intersects the coordinate axes if the function is increasing or decreasing. So, let us know these things about the given polynomial \[f\left( x \right)={{x}^{3}}.\] Here, we are assuming f(x) = y, so that the given polynomial becomes \[y={{x}^{3}}.\] To determine the point of intersection of the curves, we need to substitute x = 0 and y = 0 in the given equation one by one. So, we have,
(i) For x = 0, \[y={{0}^{3}}=0.\]
So, the curve intersects the y – axis at the origin (0, 0).
(ii) For y = 0, \[{{x}^{3}}=0,x=0.\]
So, the curve intersects the x – axis at the origin (0, 0).
Therefore, we can say that the curve \[y={{x}^{3}}\] intersects the axes at the origin only.
Now, differentiating \[y={{x}^{3}}\] with respect to x, we get,
\[\Rightarrow \dfrac{dy}{dx}=3{{x}^{2}}\]
Clearly, we can see that \[3{{x}^{2}}\] will be positive for all real values of x. So, we have,
\[\Rightarrow 3{{x}^{2}}>0\]
\[\Rightarrow \dfrac{dy}{dx}>0\]
Hence, the slope of the curve at any point will be positive.
Now, we can see that the range of the function \[f\left( x \right)={{x}^{3}}\] can be \[\left[ -\infty ,\infty \right].\] If we will substitute \[x=-\infty \] then \[f\left( x \right)=-\infty \] and if we substitute \[x=\infty \] then \[f\left( x \right)=\infty .\] So, the curve can be drawn as
Note: One may note that we cannot find the values of maxima and minima of the given equation with the help of the second derivative test because the function is extending from \[-\infty \] to \[\infty .\] Always remember the basic rules to draw a graph of a given function. First determine the points of intersection, the sign of \[\dfrac{dy}{dx}\] and then determine the maxima and minima if possible.

Recently Updated Pages
Basicity of sulphurous acid and sulphuric acid are
Master Class 12 Economics: Engaging Questions & Answers for Success
Master Class 12 Biology: Engaging Questions & Answers for Success
Master Class 11 English: Engaging Questions & Answers for Success
Master Class 11 Physics: Engaging Questions & Answers for Success
Master Class 11 Computer Science: Engaging Questions & Answers for Success
Trending doubts
Name 10 Living and Non living things class 9 biology CBSE
On an outline map of India show its neighbouring c class 9 social science CBSE
How do you solve for x in the equation xy x + y class 9 maths CBSE
The voting age has been reduced from 21 to 18 by the class 9 social science CBSE
Differentiate between parenchyma collenchyma and sclerenchyma class 9 biology CBSE
Air is a A Homogenous mixture B Heterogeneous mixture class 9 chemistry CBSE